
*** This article is written with the help of Google Translate… ***
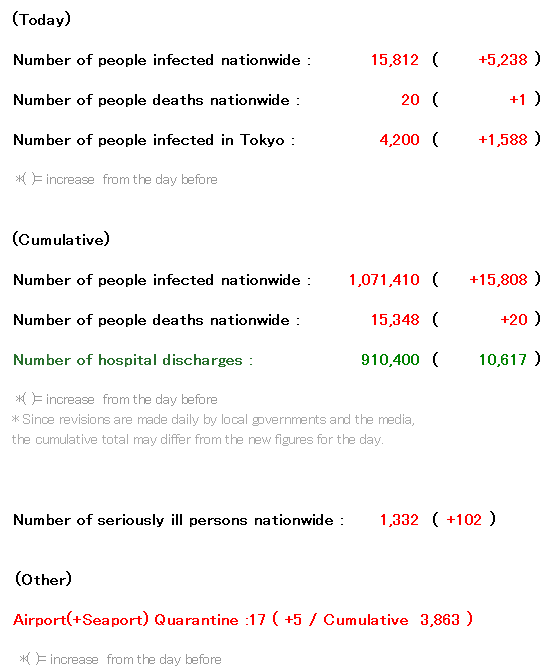
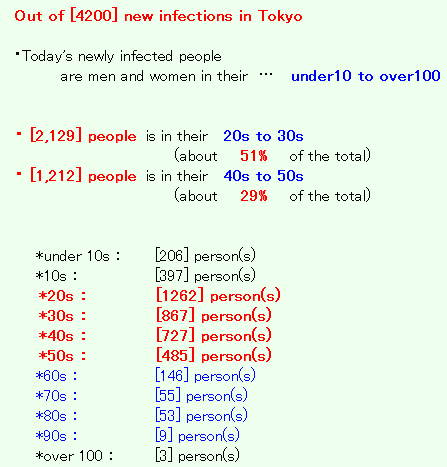
4200 ( +1,588 from the day before) new infections confirmed in Tokyo.
◆◆◆ Japan ◆◆◆
(Cumulative) * The following is up to 10 worst prefectures.
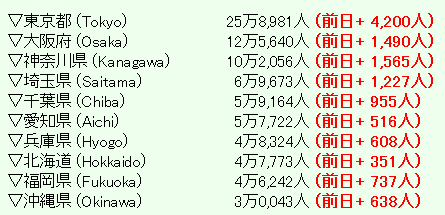
*( )= increase from the day before
(*All of the above from 2021/08/11 19:00 / NHK NEWS WEB)
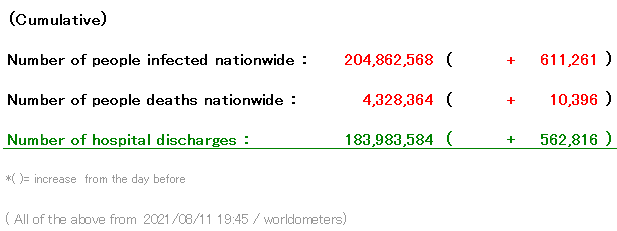
◆◆◆ World ◆◆◆
As soon as it passed “consecutive holidays + the next day”, the number of infected people in Tokyo suddenly returned to 4000 people …
Nationwide, the holidays are over today, and it seems that the number has suddenly reached a record high…
Since there are no new measures … no one will stop the spread of the infection, so the infection will not stop …
Meanwhile… How about the amount of people in the city in Tokyo…↓
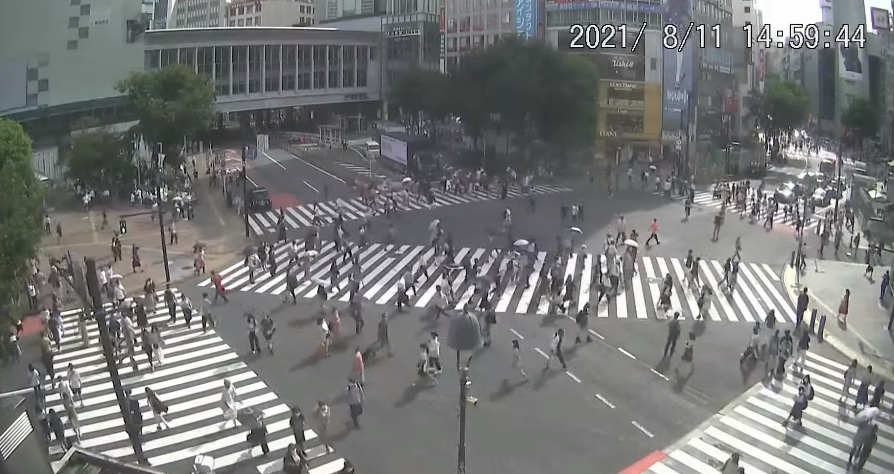
(Around 15:00 on Aug 11, Shibuya Scramble Crossing, Tokyo)
Well, I will summarize
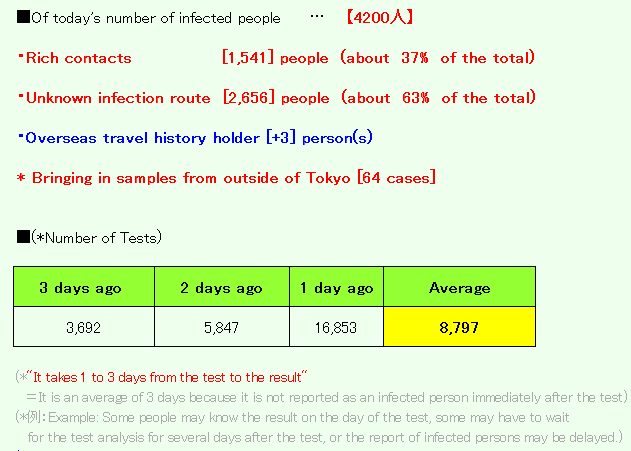
the breakdown of the number of new infections in Tokyo + α …!
・ [N/A] people is
in 『the entertainment district at night』
→Employees and guests such as host clubs and cabaret clubs
・Infection at home [936] people
・Infection at office [277] people
・Infection in the facility [99] people
・Infection by eating out [41] people
・Infection via other routes [N/A] people
*Bed usage rate: 61.5% (←60.2%)
for severely ill people: 50.3% (←44.9%)
*( )= Number of the previous day
(Individual infection information)
・”Municipal Mishima Nursery School” in Komae City
*Today [1] person(s) / Cumulative [4] person(s)
*Tokyo currently has 12 facilities for infected people
(Capacity of 5,048 people)
* A hospital in Tokyo has secured 4716 beds (+332 beds for critically ill patients).
→ According to national standards, the number of beds for severe cases was 1024.
*The hotels are that,
“the b Ikebukuro”, “DayniceHOTEL Tokyo”,
“Toyoko INN Shinjukukabukicho”,
“Toyoko INN Tokyo Station Shinoohashimae”,
“Shinagawa Prince Hotel (East Tower)”,
“Apa Hotel Asakusa Taharamachi Ekimae”,
“Tokyo Toranomon Tokyu REI Hotel”,
“Toyoko Inn Fuchu Nanbu Line Minamitama Station”,
“APA Hotel & Resort Nishi-Shinjuku 5-chome Station Tower”,
“Tokyo Pet-accompanied accommodation facility”,
“APA Hotel Yamanote Otsuka Station Tower”,
“Toyoko Inn Ikebukuro North Exit II”
*The source of the total number of infected persons is from 東京都
・Quarantine at the airport
| Case study | Response (arrival date) |
age | sex | residence | Behavior history | Symptom |
| 3549 | Haneda (7/31) |
Forties | male | Undisclosed | Indonesia | Asymptomatic |
| 3550 | Haneda (7/31) |
Forties | male | Osaka | Kyrgyzstan | Asymptomatic |
| 3551 |
Haneda (8/7) |
60s | male | Tokyo | Indonesia | Asymptomatic |
| 3552 | Haneda (8/10) |
20’s | male | Aichi prefecture | Brazil | Asymptomatic |
| 3553 | Haneda (8/10) |
20’s | male | Tokyo | England | Asymptomatic |
| 3554 | Narita (8/10) |
30s | Woman | Saitama | Sri Lanka | Asymptomatic |
| 3555 | Narita (8/10) |
50s | male | Hyogo prefecture | Indonesia | Asymptomatic |
| 3556 | Narita (8/7) |
30s | male | Chiba prefecture | Myanmar | Asymptomatic |
| 3557 | Narita (8/7) |
60s | male | Tokyo | Costa Rica, United States | Asymptomatic |
| 3558 | Narita (8/7) |
50s | male | Yamagata Prefecture | Philippines | Asymptomatic |
| 3559 | Narita (8/7) |
Under teens | male | Fukushima Prefecture | United States of America | Asymptomatic |
| 3560 | Narita (8/7) |
30s | Woman | Tokyo | Myanmar | Asymptomatic |
| 3561 | Narita (8/7) |
20’s | male | Ibaraki Prefecture | Philippines | Asymptomatic |
| 3562 | Narita (8/7) |
Forties | male | Hyogo prefecture | Myanmar | Asymptomatic |
| 3563 | Narita (8/10) |
Under teens | Woman | Hyogo prefecture | United States of America | Asymptomatic |
| 3564 | Narita (8/8) |
30s | male | Fukushima Prefecture | Ghana | Asymptomatic |
| 3565 | Haneda (8/11) |
Forties | male | Undisclosed | Nigeria | Asymptomatic |
*From the website of the Ministry of Health, Labor and Welfare
*Currently, Japan is refusing to enter from India, Nepal, and Pakistan in principle as a countermeasure against Indian variant stain.
*Since the number of new infections in Tokyo seems to be almost the number of the previous day,
(Because the deadline for the number of new infections on the day is from 9:00 am the day before to 9:00 am on the day)
And also today, I will summarize some prefectures that have a high number of infected people, not just in the Tokyo area.
*** Saitama ***
・New infections are [1227] people
→Saitama City [307] person(s)
Kawaguchi City [58] person(s)
Koshigaya City [54] person(s)
Kawagoe City [19] person(s)
Other municipalities [789] person(s)
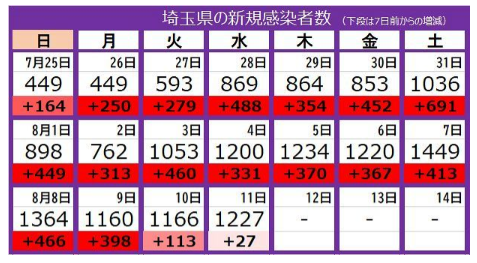
(*東京新聞)
* I’m sorry, but the number of people in Saitama by region comes out, but the details are often late or not come out on the day …
*** Kanagawa ***
・New infections are [1565] people
・Rich contacts [-] people
・Unknown infection route [-] people
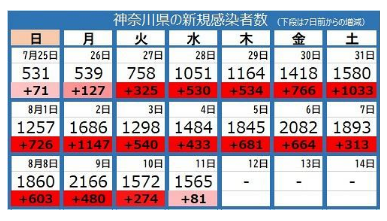
(*東京新聞)
(Individual infection information)
・Support facility for persons with disabilities in Kamakura jurisdiction
*Today [4] person(s) / Cumulative [12] person(s)
・ “Maritime Self-Defense Force” in Yokosuka City
*Today [6] person(s) / Cumulative [N/A] person(s)
・After-school day service in Yokohama City
*Today [3] person(s) / Cumulative [8] person(s)
*Among the infected people counted today, there are [5] cluster relationships, including the above… (Other than the above, add 1 or less each)
*** Chiba ***
・New infections are [955] people

(*東京新聞)
(Individual infection information)
・Concierge Maihama, a facility for the elderly in Urayasu City
*Today [3] person(s) / Cumulative [9] person(s)
・Cram school “Shonan Seminar Elementary and Chubu Nishi Funabashi Class” in Funabashi City
*Today [6] person(s) / Cumulative [87] person(s)
*The following areas introduced until the other day will be excluded for a while.
①About “Osaka / Aichi / Okinawa / Hyogo / Kyoto”
→I have summarized this for the past year, but the details of the infection rarely appear during the day.
②About “Hokkaido”
→Infection is settling down
* Others At this time (20:00), it seems that more than 10 people have been confirmed to be infected in the following areas …
↓ Today, all areas other than “Worst 10”
▽ Kyoto Prefecture has 20,970 people (341)
▽ Ibaraki Prefecture has 14,964 people (180)
▽ Hiroshima prefecture has 13,076 people (112)
▽ Shizuoka Prefecture has 12,888 people (288)
▽ Miyagi Prefecture has 10,847 people (142)
▽ Gifu Prefecture has 10,183 people (123)
▽ Gunma Prefecture has 10,166 people (173)
▽ Nara Prefecture has 9815 people (138)
▽ Tochigi Prefecture has 9676 people (166)
▽ Okayama Prefecture has 9223 people (137)
▽ Kumamoto Prefecture has 8164 people (181)
▽ Shiga Prefecture has 7,000 people (162)
▽ Fukushima Prefecture has 6730 people (111)
▽ Mie Prefecture has 6510 people (111)
▽ Ishikawa Prefecture has 5911 people (75)
▽ Nagano Prefecture has 5843 people (73)
▽ Niigata Prefecture has 4755 people (74)
▽ Kagoshima Prefecture has 4677 people (108)
▽ Oita Prefecture has 4070 people (61)
▽ Nagasaki Prefecture has 3887 people (55)
▽ Miyazaki Prefecture has 3573 people (44)
▽ Yamaguchi Prefecture has 3543 people (47)
▽ Ehime Prefecture has 3316 people (85)
▽ Wakayama Prefecture has 3308 people (36)
▽ Saga Prefecture has 3131 people (73)
▽ Yamanashi Prefecture has 2991 people (54)
▽ Aomori Prefecture has 2986 people (77)
▽ Kagawa Prefecture has 2702 people (65)
▽ Toyama Prefecture has 2695 people (46)
▽ Yamagata Prefecture has 2436 people (43)
▽ Iwate Prefecture has 2245 people (40)
▽ Kochi Prefecture has 2214 people (20)
▽ Fukui Prefecture has 1917 people (15)
▽ Tokushima Prefecture has 1876 people (5)
▽ Akita Prefecture has 1117 people (13)
▽ Tottori prefecture has 1034 people (23)
▽ Shimane Prefecture has 839 people (12)
*Graph of the number of newly infected people in Japan as of yesterday
(* This bar graph is up to the previous day, so today’s red bar (handwritten) is on the far right, but it’s about this …)
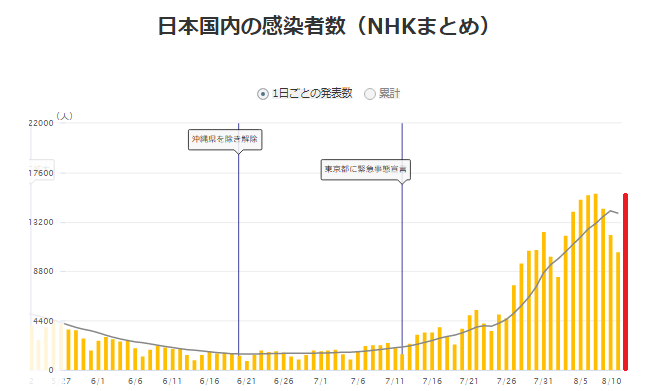
(*”Since the graph shows only the numbers up to the previous day, I handwritten the rightmost bar, but this is about it!”)
(*NHK NEWS WEB)
<Summary of today’s “Major News Related to COVID-19 in Japan”>
<Areas subject to “Emergency declaration” and “Priority measures such as prevention of spread”>
State of emergency
Target area : Tokyo, Okinawa
Saitama, Kanagawa, Chiba, Osaka
Priority measures such as prevention of spread
Target area : Hokkaido, Ishikawa, Hyogo, Kyoto, Fukuoka
(Added on August 8 ↓)
Fukushima, Ibaraki, Tochigi, Gunma, Shizuoka, Aichi, Shiga, Kumamoto
●Period: August 2nd to August 31st
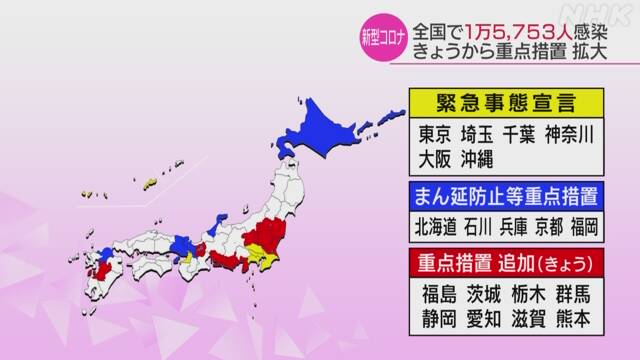
(*4府県“宣言”追加 5道府県“まん延防止”適用を決定 政府 – NHK)
(まん延防止等重点措置 きょうから拡大 不要不急の外出自粛を – NHK)
There wasn’t much news about COVID-19 today, so I’ll focus on data that is not usually reported!
..Because I think you’re watching the “graph of the number of infected people in Japan” on the news and TV … lol
would like to review the current situation in Japan and Tokyo before the Obon holidays!
(* All data are from Tokyo Metropolitan Health and Welfare Bureau and NHK!)
First of all, the number of seriously ill people in Tokyo! ↓
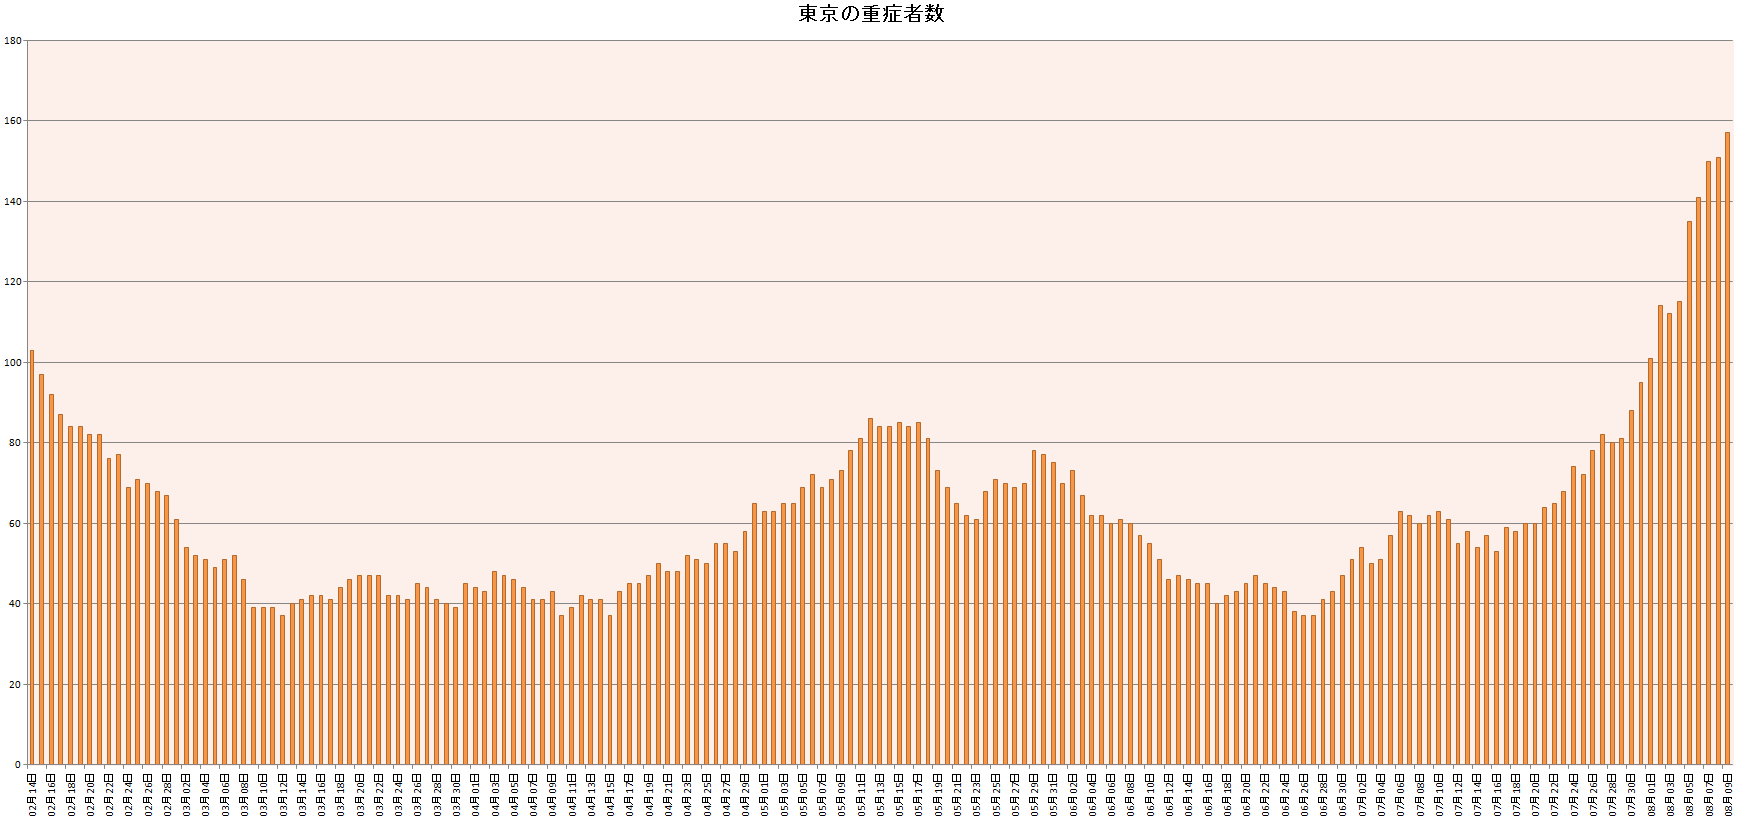
↑ The data is from February when the infection situation in Japan has settled down after the 3rd wave, but the current number of seriously ill people is “twice that of the 4th wave”…
By the way, I also make a note of the ages of the most seriously ill people in Tokyo these days! ↓
| date | under 10 | 10s | 20s | 30s | 40s | 50s | 60s | 70s | 80s | 90s | over 100 | N/A | Total |
| 8/10 | 0 | 1 | 4 | 14 | 43 | 62 | 32 | 17 | 3 | 0 | 0 | 0 | 176 |
| 8/9 | 0 | 1 | 4 | 10 | 36 | 58 | 29 | 16 | 3 | 0 | 0 | 0 | 157 |
| 8/8 | 0 | 1 | 4 | 10 | 36 | 54 | 27 | 16 | 3 | 0 | 0 | 0 | 151 |
| 8/7 | 0 | 1 | 3 | 11 | 33 | 56 | 26 | 16 | 4 | 0 | 0 | 0 | 150 |
| 8/6 | 0 | 1 | 2 | 11 | 30 | 55 | 21 | 17 | 4 | 0 | 0 | 0 | 141 |
| 8/5 | 0 | 1 | 2 | 9 | 25 | 57 | 21 | 16 | 4 | 0 | 0 | 0 | 135 |
| 8/4 | 0 | 0 | 2 | 6 | 22 | 48 | 19 | 15 | 3 | 0 | 0 | 0 | 115 |
| 8/3 | 0 | 0 | 2 | 6 | 24 | 45 | 19 | 13 | 3 | 0 | 0 | 0 | 112 |
| 8/2 | 0 | 0 | 2 | 8 | 26 | 44 | 19 | 12 | 3 | 0 | 0 | 0 | 114 |
| 8/1 | 0 | 0 | 2 | 6 | 17 | 36 | 19 | 15 | 1 | 0 | 0 | 5 | 101 |
| 7/31 | 0 | 0 | 2 | 7 | 17 | 32 | 21 | 16 | 0 | 0 | 0 | 0 | 95 |
| 7/30 | 0 | 0 | 2 | 6 | 16 | 31 | 18 | 15 | 0 | 0 | 0 | 0 | 88 |
| 7/29 | 1 | 0 | 2 | 3 | 16 | 27 | 18 | 14 | 0 | 0 | 0 | 0 | 81 |
| 7/28 | 0 | 0 | 1 | 3 | 17 | 30 | 15 | 14 | 0 | 0 | 0 | 0 | 80 |
| 7/27 | 0 | 0 | 0 | 3 | 17 | 26 | 19 | 17 | 0 | 0 | 0 | 0 | 82 |
| 7/26 | 0 | 0 | 0 | 4 | 18 | 23 | 17 | 16 | 0 | 0 | 0 | 0 | 78 |
| 7/25 | 0 | 0 | 2 | 5 | 13 | 18 | 18 | 15 | 1 | 0 | 0 | 0 | 72 |
| 7/24 | 0 | 0 | 2 | 5 | 14 | 19 | 18 | 15 | 1 | 0 | 0 | 0 | 74 |
The graph looks like this … ↓
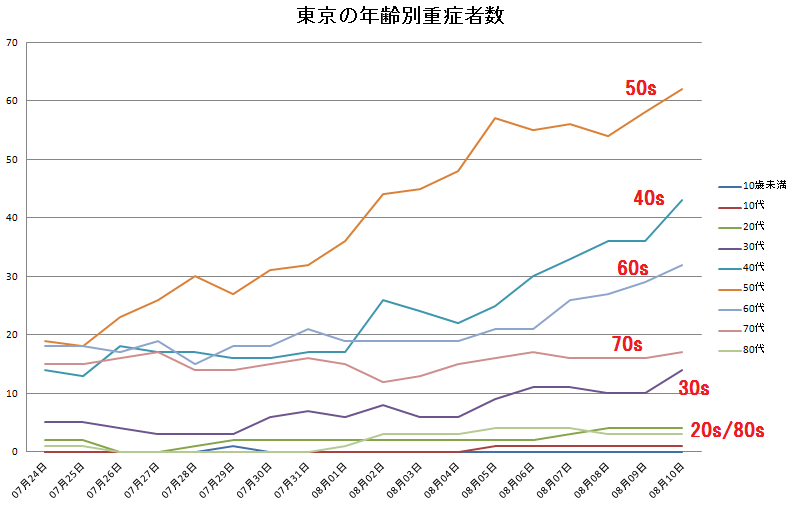
↑ As reported, the number of people in their 40s and 50s has increased considerably, but in reality, the number of people in their 20s and 30s has also increased …
The number of people in their 20s is higher than in their 80s …
Next, the number of deaths nationwide is like this … ↓
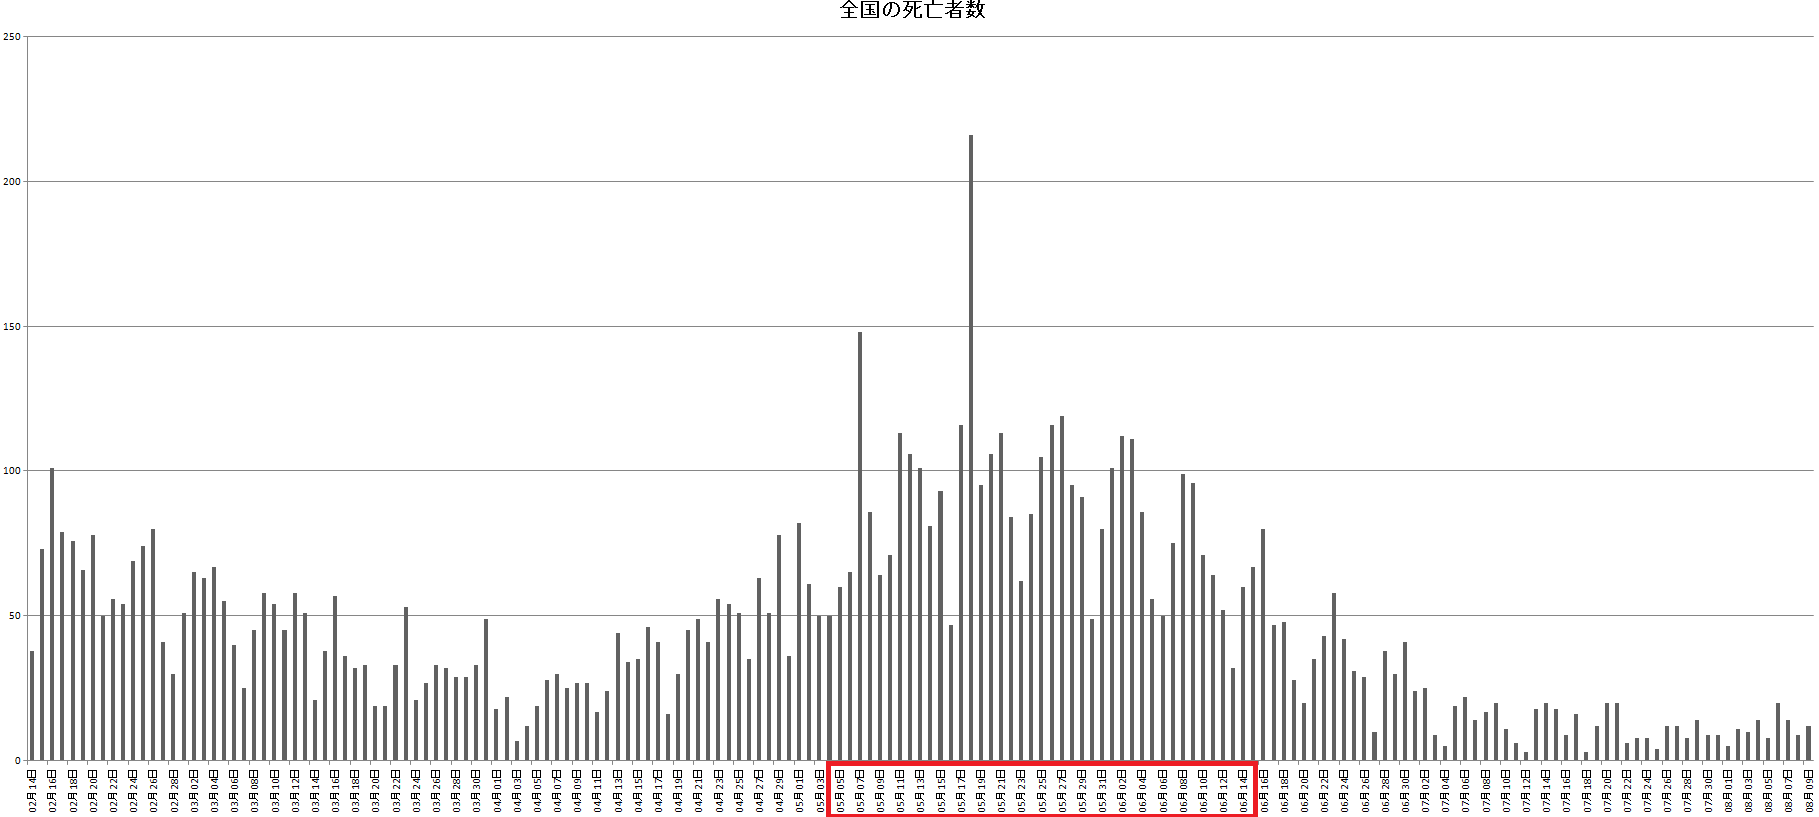
It is true that the number of deaths has been small recently, probably because of the progress of vaccination of the elderly.
However, the number of deaths is about 3 weeks to 1 month after the outbreak of infection, so we must not let our guard down …
It’s about the end of Obon to the end of August, but what will it look like …
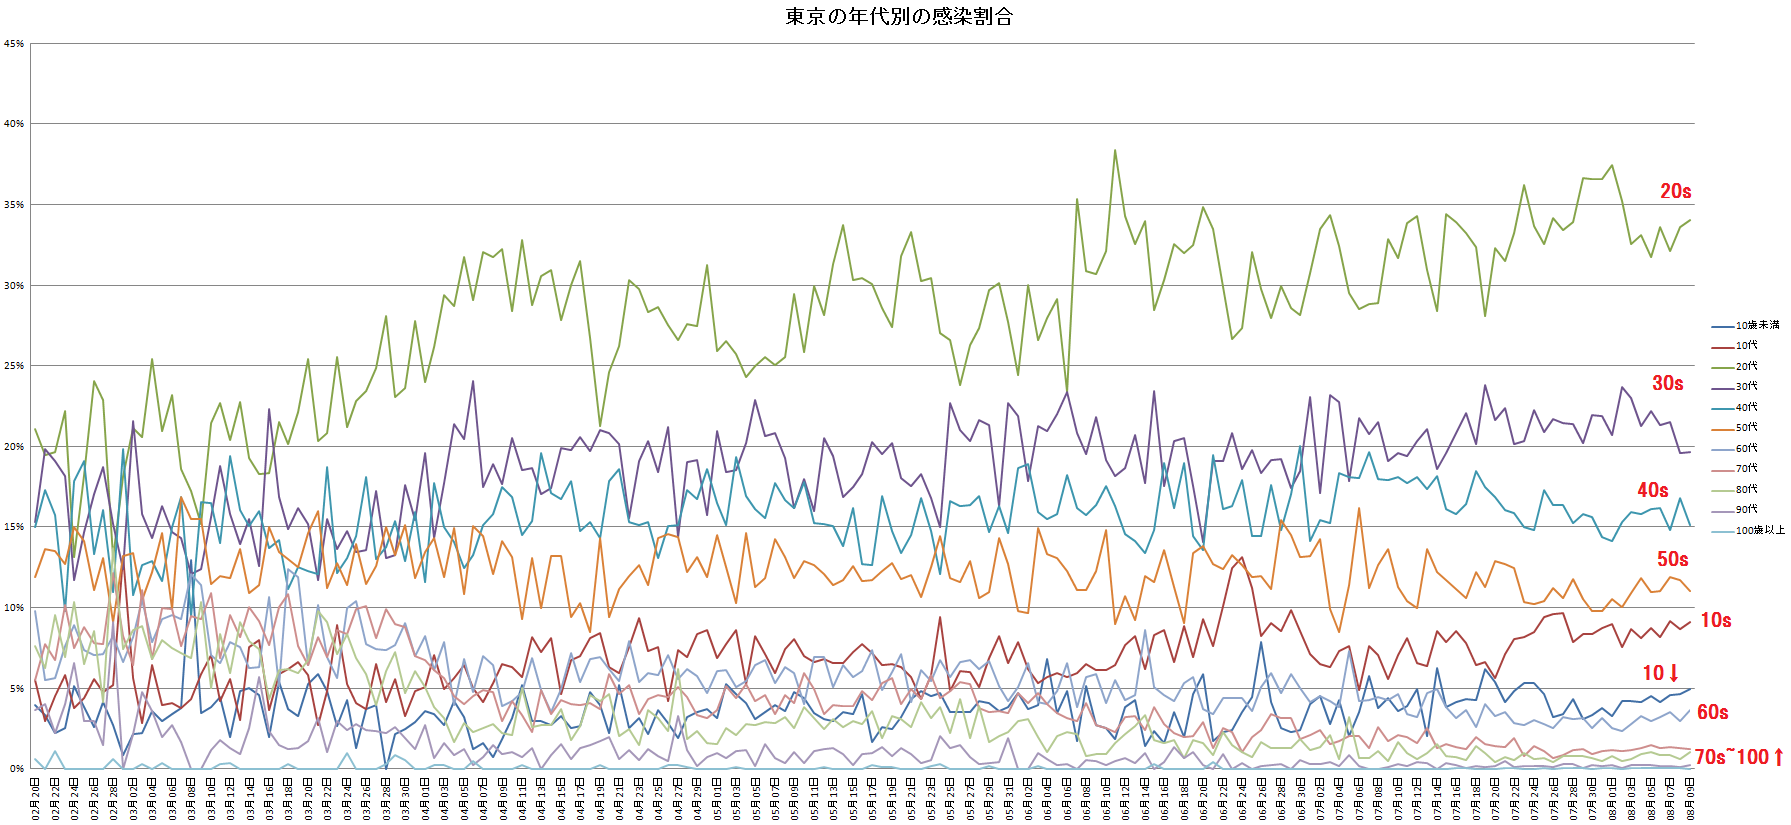
And the current “infection rate by age” in Tokyo looks like this! ↓
↑
In the 20s, the number of infected people and the proportion of infected people are still increasing, and I feel that the number of people in their teens and under 10 is increasing.
The percentage of people in their 30s to 50s is slightly flat or decreasing, but it seems that the percentage of people under 10 years old, teens, and 20s is decreasing too much …
The percentage of people in their 30s to 50s is a little flat or is decreasing a little, but it seems that the percentage of people under 10 years old, teens and 20s is increasing too much, so as a result, the ratio of 30s to 50s is decreasing …
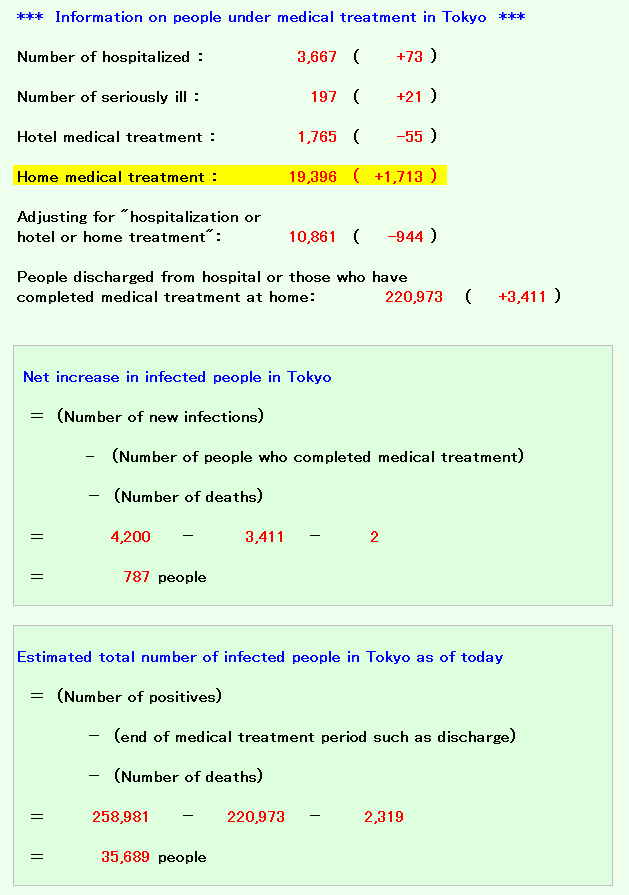
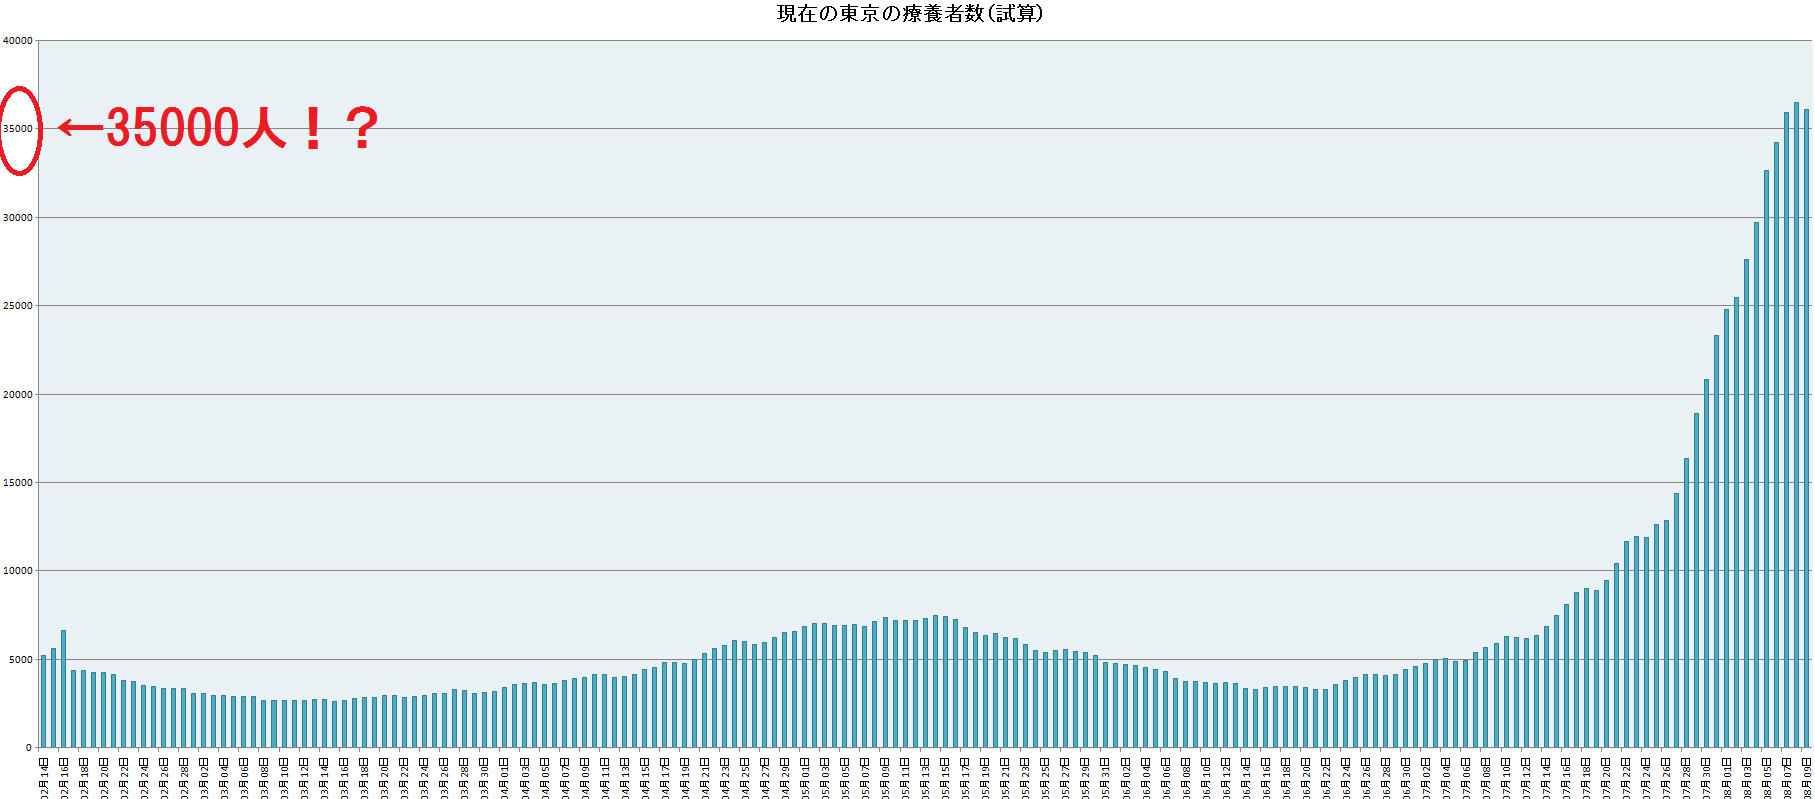
And today’s last data is about the current total number of COVID-19 patients (including home care)! ↓
Tokyo,
and Nationwide…
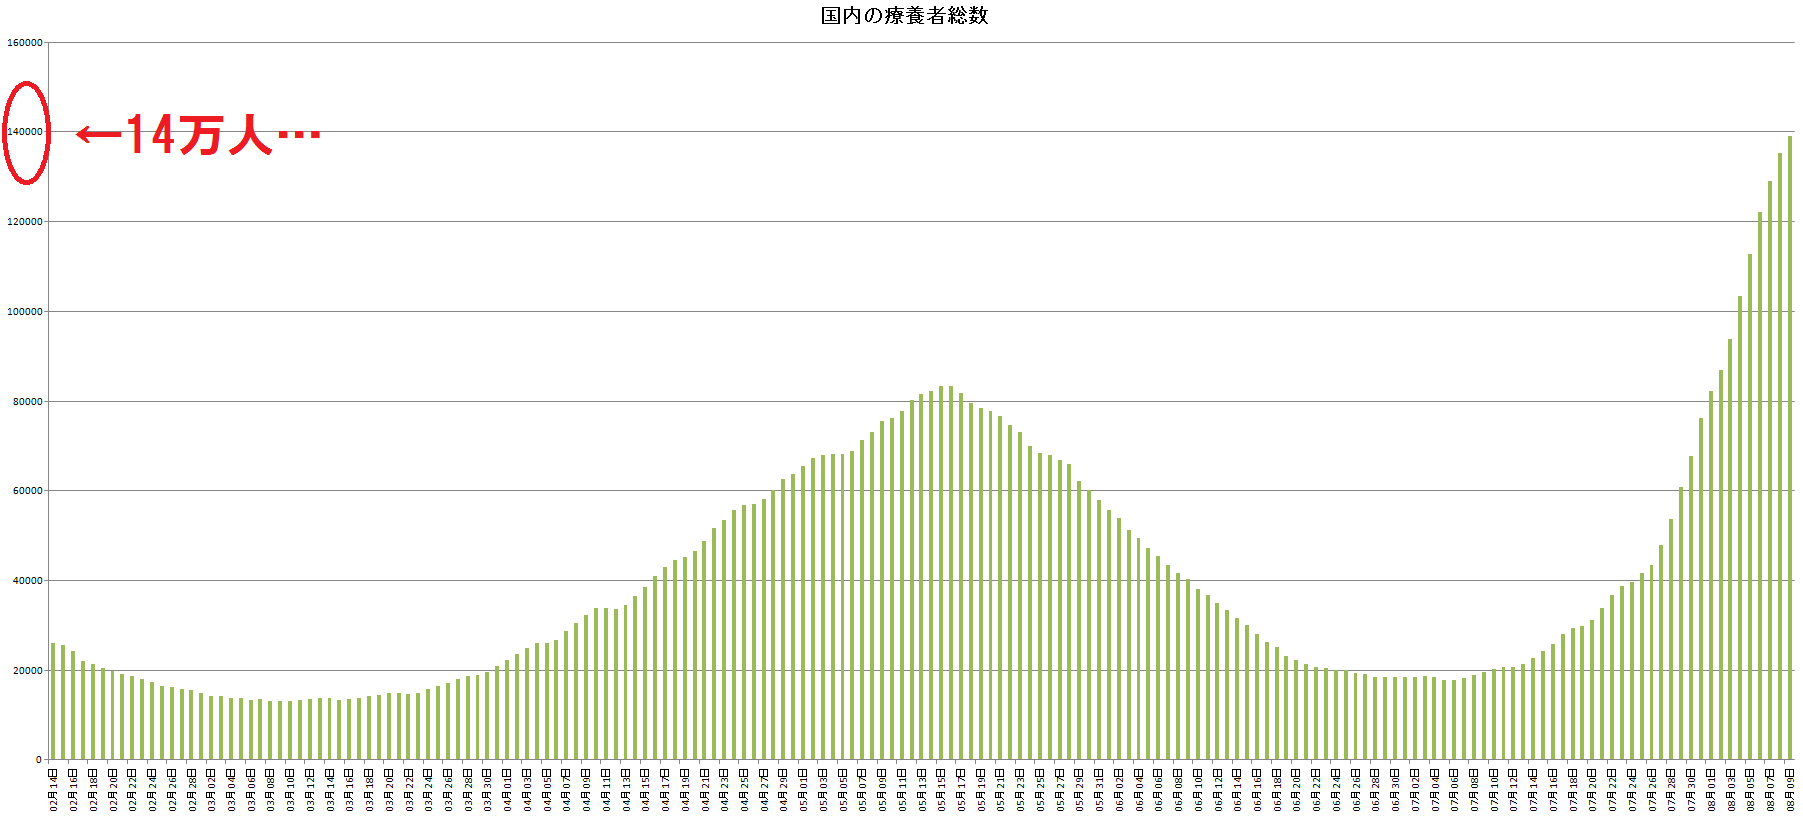
Some people say, “COVID-19 is just a cold!”, but the illness that has 35,000 patients (140,000 nationwide) at this time is still abnormal, isn’t it?
If you have any data you want to know, something you noticed, or something you are interested in, please feel free to let us know!
I will investigate!
And this article↓
How long time the materials such as paper, cloth, plastic, etc. need to eliminating the risk when coronavirus is attached, and how effective disinfection is.
If you are interested, please take a look!
Also, for “Does the vaccine work for mutant strains?”, See this table ↓
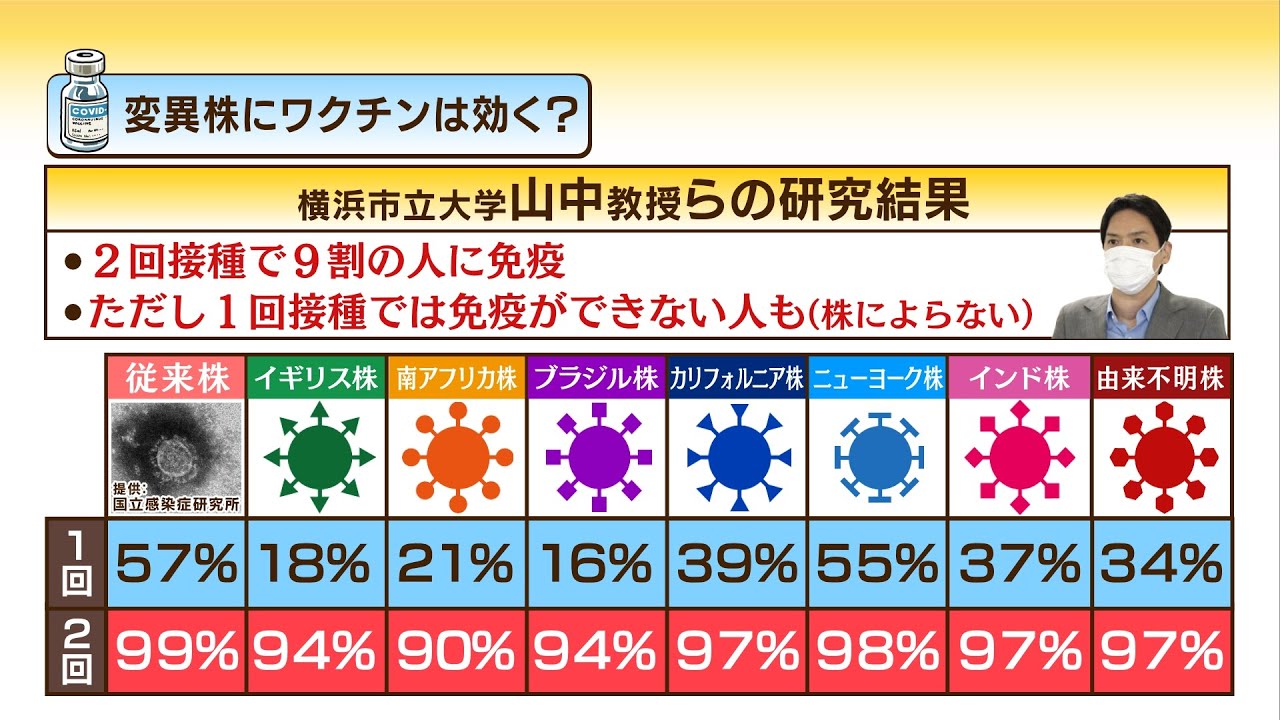
イギリス株やインド株にもワクチンは“90%以上有効” – Youtube(MBS news)
ファイザー製ワクチン ブラジル株に効果期待 東大らのグループ – NHK
↓
| Is the vaccine effective against mutant strains? (*unit : %) | ||||||||
| Number of vaccinations | Conventional | British | South african | Brazilian | California | NY | Indian | Unknown |
| Once | 57 | 18 | 21 | 16 | 39 | 55 | 37 | 34 |
| Twice | 99 | 94 | 90 | 94 | 97 | 98 | 97 | 97 |
And here’s a trial calculation of how many people in Japan are actually receiving medical treatment.
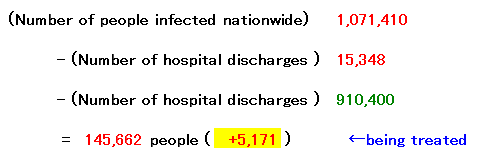
(If it is exactly as announced)
For those who are undergoing medical treatment nationwide are…
these days it’s been declining significantly on most days, but…
Today, I reviewed the domestic infection situation with data!
What will happen after the Obon holiday …
Well…., I’m only scared…..!
Please be careful when you go out!
AcertainFox512
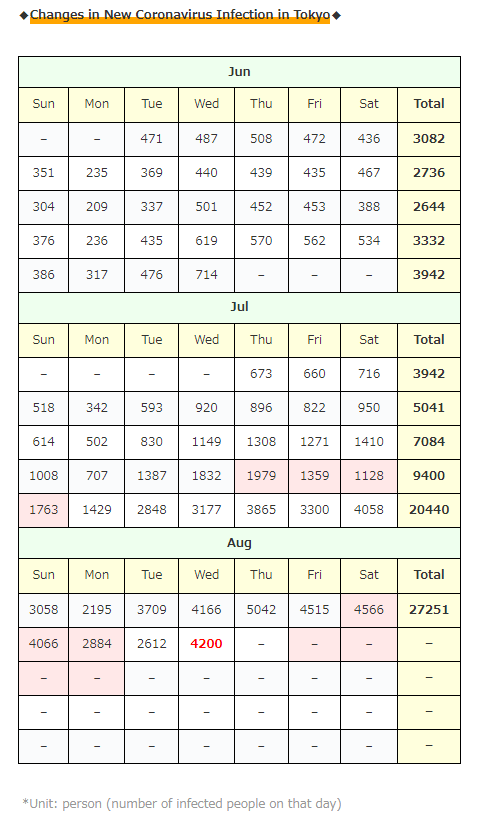
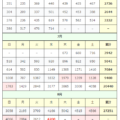
◆Changes in New Coronavirus Infection in Tokyo◆
| Jun | |||||||
| Sun | Mon | Tue | Wed | Thu | Fri | Sat | Total |
| – | – | 471 | 487 | 508 | 472 | 436 | 3082 |
| 351 | 235 | 369 | 440 | 439 | 435 | 467 | 2736 |
| 304 | 209 | 337 | 501 | 452 | 453 | 388 | 2644 |
| 376 | 236 | 435 | 619 | 570 | 562 | 534 | 3332 |
| 386 | 317 | 476 | 714 | – | – | – | 3942 |
| Jul | |||||||
| Sun | Mon | Tue | Wed | Thu | Fri | Sat | Total |
| – | – | – | – | 673 | 660 | 716 | 3942 |
| 518 | 342 | 593 | 920 | 896 | 822 | 950 | 5041 |
| 614 | 502 | 830 | 1149 | 1308 | 1271 | 1410 | 7084 |
| 1008 | 707 | 1387 | 1832 | 1979 | 1359 | 1128 | 9400 |
| 1763 | 1429 | 2848 | 3177 | 3865 | 3300 | 4058 | 20440 |
| Aug | |||||||
| Sun | Mon | Tue | Wed | Thu | Fri | Sat | Total |
| 3058 | 2195 | 3709 | 4166 | 5042 | 4515 | 4566 | 27251 |
| 4066 | 2884 | 2612 | 4200 | – | – | – | – |
| – | – | – | – | – | – | – | – |
| – | – | – | – | – | – | – | – |
| – | – | – | – | – | – | – | – |
*Unit: person (number of infected people on that day)

コメント