
*** This article is written with the help of Google Translate… ***
235 ( -116 from the day before) new infections confirmed in Tokyo.
◆◆◆ Japan ◆◆◆
(Today)
Number of people infected nationwide : 1,278 ( -744)
Number of people deaths nationwide : 75 ( +25)
Number of people infected in Tokyo : 235 ( -116)
*( )= increase from the day before
(Cumulative)
Number of people infected nationwide : 764,497 ( +1,274)
Number of people deaths nationwide : 13,673 ( +75)
Number of hospital discharges : 707,303 ( +3,119)
*( )= increase from the day before
* Since revisions are made daily by local governments and the media,
the cumulative total may differ from the new figures for the day.
Number of seriously ill persons nationwide : 1,120 ( -11)
(Other)
Airport(+Seaport) Quarantine : 2 ( -3 / Total 3,157)
*( )= increase from the day before
(Cumulative) * The following is up to 10 worst prefectures.
▽東京都 (Tokyo) 163,915人 (前日+ 235人)
▽大阪府 (Osaka) 100,933人 (前日+ 72人)
▽神奈川県 (Kanagawa) 62,987人 (前日+173人)
▽愛知県 (Aichi) 48,919人 (前日+ 97人)
▽埼玉県 (Saitama) 44,488人 (前日+ 44人)
▽兵庫県 (Hyogo) 40,225人 (前日+ 22人)
▽北海道 (Hokkaido) 39,639人 (前日+ 147人)
▽千葉県 (Chiba) 37,803人 (前日+ 68人)
▽福岡県 (Fukuoka) 34,670人 (前日+ 27人)
▽沖縄県 (Okinawa) 18,603人 (前日+ 104人)
*( )= increase from the day before
▽京都府 (Kyoto) 16,112人 (前日+ 10人)
(*All of the above from 2021/06/07 19:00 / NHK NEWS WEB)
◆◆◆ World ◆◆◆
(Cumulative)
Number of people infected nationwide : 174,092,834 ( +324,685)
Number of people deaths nationwide : 3,745,093 ( +7,527)
Number of hospital discharges : 157,121,360 ( +474,139)
( All of the above from 2021/06/07 20:00 / worldometers)
*( )= increase from the day before
The number of newly infected people in Tokyo has decreased considerably because it is Monday!
However, it seems that it doesn’t change much compared to last week …
Meanwhile… How about the amount of people in the city in Tokyo…↓
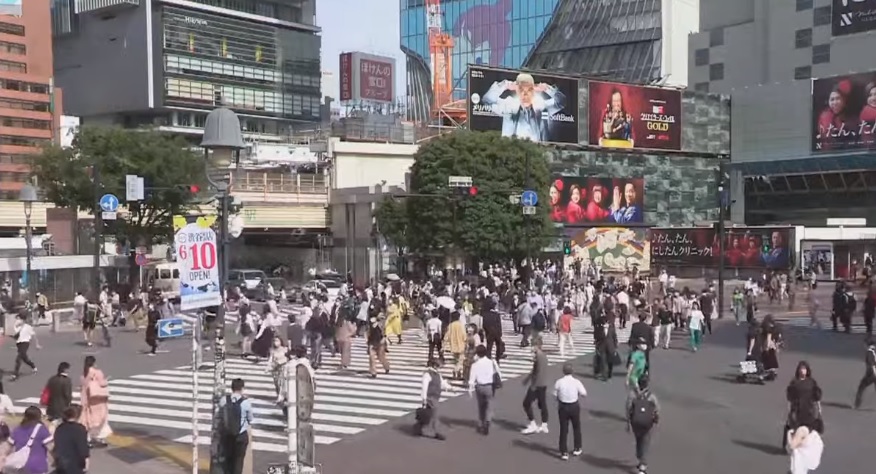
(Around 15:00 on Jan 07, Shibuya Scramble Crossing, Tokyo)
Well, I will summarize
the breakdown of the number of new infections in Tokyo + α …!
Out of [235] new infections in Tokyo
・Today’s newly infected people are men and women in their under10 to 80s
・[132] people is in their 20s to 30s
(about 56% of the total)
・[164] people is in their 40s to 50s
(about 27% of the total)
*under10 : [4] persons
*10s : [14] persons
*20s : [83] persons
*30s : [49] persons
*40s : [38] persons
*50s : [26] persons
*60s : [9] persons
*70s : [7] persons
*80s : [5] persons
*90s : [0] persons
*over100 : [0] persons
・ [N/A] people is
in 『the entertainment district at night』
→Employees and guests such as host clubs and cabaret clubs
・Infection at home [57] people
・Infection at office [18] people
・Infection in the facility [4] people
・Infection by eating out [6] people
・Infection via other routes [N/A] people
*Bed usage rate: 31.0% (←31.9%)
for severely ill people: 16.4% (←16.1%)
*( )= Number of the previous day
(Individual infection information)
・ I couldn’t confirm the information today …
*** Information on people under medical treatment in Tokyo ***
Number of hospitalized : 1,734 ( -48)
Number of seriously ill : 61 ( +1)
Hotel medical treatment : 857 ( -44)
Home medical treatment : 999 ( -66)
Adjusting for “hospitalization or hotel or home treatment” : 347 ( -191)
People discharged from hospital or
those who have completed medical treatment at home: 157,867 ( +581)
*( )= increase from the day before
Net increase in infected people in Tokyo
= (Number of new infections)
- (Number of people who completed medical treatment)
- (Number of deaths)
= 235 - 581 - 3
= -349 people
Estimated total number of infected people in Tokyo as of today
= (Number of positives)
- (end of medical treatment period such as discharge)
- (Number of deaths)
= 163,915 - 157,867 - 2,111
= 3,937 people
*Tokyo currently has 12 facilities for infected people
(Capacity of 5,048 people)
* A hospital in Tokyo has secured 4716 beds (+332 beds for critically ill patients).
→ According to national standards, the number of beds for severe cases was 1024.
*The hotels are that,
“the b Ikebukuro”, “DayniceHOTEL Tokyo”,
“Toyoko INN Shinjukukabukicho”,
“Toyoko INN Tokyo Station Shinoohashimae”,
“Shinagawa Prince Hotel (East Tower)”,
“Apa Hotel Asakusa Taharamachi Ekimae”,
“Tokyo Toranomon Tokyu REI Hotel”,
“Toyoko Inn Fuchu Nanbu Line Minamitama Station”,
“APA Hotel & Resort Nishi-Shinjuku 5-chome Station Tower”,
“Tokyo Pet-accompanied accommodation facility”,
“APA Hotel Yamanote Otsuka Station Tower”,
“Toyoko Inn Ikebukuro North Exit II”
*The source of the total number of infected persons is from 東京都
■ Of today’s number of infected people [235] …
・Rich contacts [95] people
(about 40% of the total)
・Unknown infection route [140] people
(about 60% of the total)
・Overseas travel history holder [0] person(s)
* Bringing in samples from outside of Tokyo [9 cases]
■(*Number of Tests)
| 3 days ago | 2 days ago | 1 day ago | Average |
| 7720 | 4249 | 1451 | 4473 |
(*“It takes 1 to 3 days from the test to the result”
=It is an average of 3 days because it is not reported as an infected person immediately after the test)
(*例:Example: Some people may know the result on the day of the test, some may have to wait for the test analysis for several days after the test, or the report of infected persons may be delayed.
・Quarantine at the airport
| Case study | Response (arrival date) |
Age | sex | residence | Behavior history | Symptom |
| 2962 | Haneda (6/6) |
50s | male | Undisclosed | Kyrgyzstan | Sore throat |
| 2963 | Haneda (6/7) |
50s | male | Chiba prefecture | India | Dysgeusia, dysosmia |
*Currently, Japan is refusing to enter from India, Nepal, and Pakistan in principle as a countermeasure against Indian variant stain.
*Since the number of new infections in Tokyo seems to be almost the number of the previous day,
(Because the deadline for the number of new infections on the day is from 9:00 am the day before to 9:00 am on the day)
And also today, I will summarize some prefectures that have a high number of infected people, not just in the Tokyo area.
*** Saitama ***
・New infections are [44] people
→Saitama City [4] person(s)
Kawaguchi City [7] person(s)
Koshigaya City [1] person(s)
Kawagoe City [1] person(s)
Other municipalities [31] person(s)
* I’m sorry, but the number of people in Saitama by region comes out, but the details are often late or not come out on the day …
*** Kanagawa ***
・New infections are [173] people
・Rich contacts [81] people
・Unknown infection route [92] people
(Individual infection information)
・”Showa University Northern Yokohama Hospital” in Yokohama City
*Today [2] person(s) / Cumulative [9] person(s)
・Manufacturing company in Sagamihara City
*Today [1] person(s) / Cumulative [18] person(s)
*Among the infected people counted today, there are [8] cluster relationships, including the above… (Other than the above, add 1 or less each)
*** Chiba ***
・New infections are [68] people
(Individual infection information)
・Kyabakura “Club Ali” who did not respond to Kimitsu City’s request at all
*Today [1] person(s) / Cumulative [14] person(s)
* Currently, in Chiba, cluster information is not coming out much again …
(I have the impression that they haven’t given much information since autumn)
*** Osaka ***
・New infections are [72] people
・ I couldn’t confirm the information today …
*** Aichi ***
・New infections are [97] people
→Nagoya City [51] people
*** Okinawa ***
・New infections are [104] people
→US military base:[N/A] person(s)
*Cumulative 919 US military personel
*Not included in the number of infected people in Okinawa
*** Fukuoka ***
・New infections are [27] person(s)
→Fukuoka City [12] people
→Kitakyushu City [6] people
→Kurume City [-] people
◆◆◆ Hokkaido ◆◆◆
・New infections are [147] person(s)
→Sapporo City [91] people
(Individual infection information)
・Special elderly nursing home “Ikeda Chojuen” in Tokachi / Ikeda Town
*Today [2] person(s) / Cumulative [13] person(s)
・”Obihiro Daiichi Hospital” in Obihiro City
*Today [1] person(s) / Cumulative [80] person(s)
*Among the infected people counted today, there are [10] cluster relationships, including the above… (Other than the above, add 1 or less each)
* In Hokkaido, outbreaks are rarely known on the day of the outbreak, and since it will be revealed and announced the next day or later, the cumulative number of people will be announced instead of the number on the day of the outbreak.
◆◆◆ Hyogo ◆◆◆
・New infections are [22] person(s)
・ I couldn’t confirm the information today …
◆◆◆ Kyoto ◆◆◆
・New infections are [10] person(s)
・ I couldn’t confirm the information today …
* Others At this time (20:30), it seems that more than 10 people have been confirmed to be infected in the following areas …
▽ Hiroshima prefecture has 10,041 people (29)
▽ Ibaraki Prefecture has 9949 people (24)
▽ Gifu Prefecture has 8953 people (25)
▽ 8662 people (23) in Shizuoka prefecture
▽ Gunma Prefecture has 7928 people (11)
▽ Okayama Prefecture has 7488 people (12)
▽ Tochigi Prefecture has 6509 people (21)
▽ Shiga Prefecture has 5311 people (15)
▽ Fukushima Prefecture has 4656 people (13)
▽ Yamanashi Prefecture has 1684 people (12)
▽ 1610 people (10) in Kochi prefecture
*Graph of the number of newly infected people in Japan as of yesterday
(* This bar graph is up to the previous day, so today’s red bar (handwritten) is on the far right, but it’s about this …)
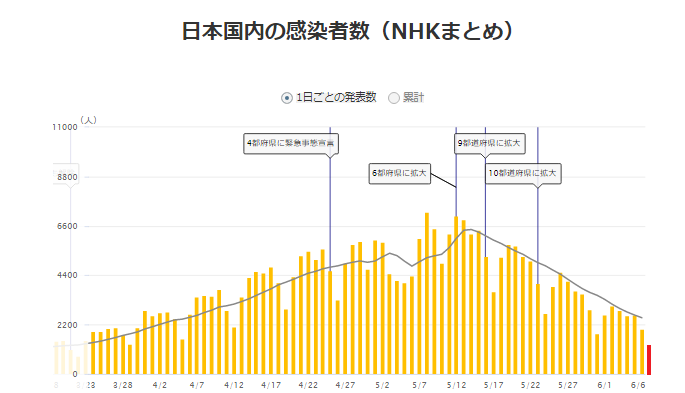
(*”Since the graph shows only the numbers up to the previous day, I handwritten the rightmost bar, but this is about it!”)
(*NHK NEWS WEB)
<Areas subject to “Emergency declaration” and “Priority measures such as prevention of spread”>
(* As of May 15)
●State of emergency (* until March 31)→Extended by June 20
Tokyo / Osaka / Hyogo / Kyoto / Aichi / Fukuoka
Hokkaido / Okayama / Hiroshima
(And… add more) Okinawa (*5/23~6/20)
● Priority measures such as prevention of spread
Saitama / Chiba / Kanagawa / Ehime / Gifu / Mie
Ishikawa / Gunma / Kumamoto→(3 prefectures) Scheduled for early cancellation
→Ehime will be removed on May 22nd
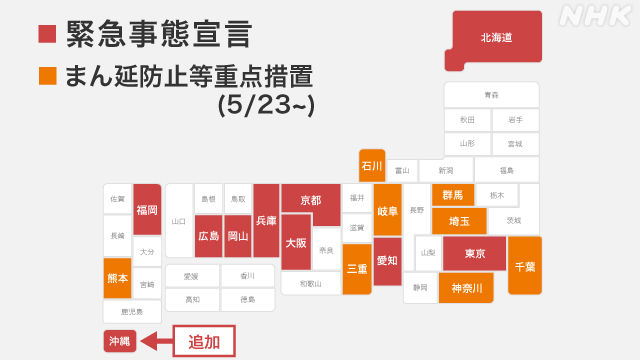
(* Orange = Priority measures to prevent spread / Red = State of emergency)
(*緊急事態宣言 6都府県に拡大 “まん延防止”は8道県に拡大 – NHK)
(*群馬など5つの県に“まん延防止”適用方針 – Yahoo!)
(*沖縄県に「緊急事態宣言」 23日から来月20日まで 政府が決定 – NHK)
9都道府県の緊急事態宣言 来月20日まで延長を決定 政府 – NHK
【随時更新】菅首相会見「警戒すべきは変異株の影響」 – NHK
I didn’t have much news about the new coronavirus, so today I’d like to organize only the recent data that I’m a little worried about about Tokyo!
(*All data are graphed independently based on 東京都の感染症対策サイト!)
First of all, the number of infected people in Tokyo these days is like this … ↓
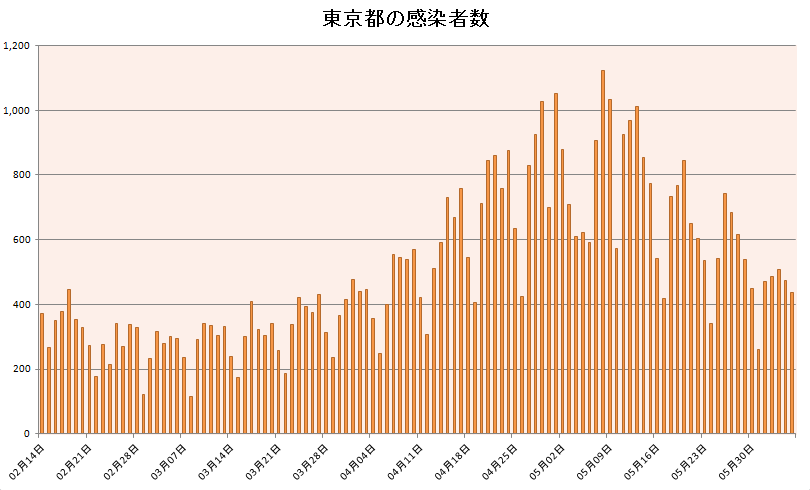
↑This is shown on TV and the Internet every day, so you can imagine the shape even if you close your eyes, right?! (Lol)
By the way … how many COVID-19 patients are there now …?
There was only information and topics on the number of newly infected people every day, and unexpectedly there is not much data on it on major sites and TV, so I summarized it!
First of all, the daily increase and decrease in the number of people undergoing medical treatment in Tokyo was like this! ↓
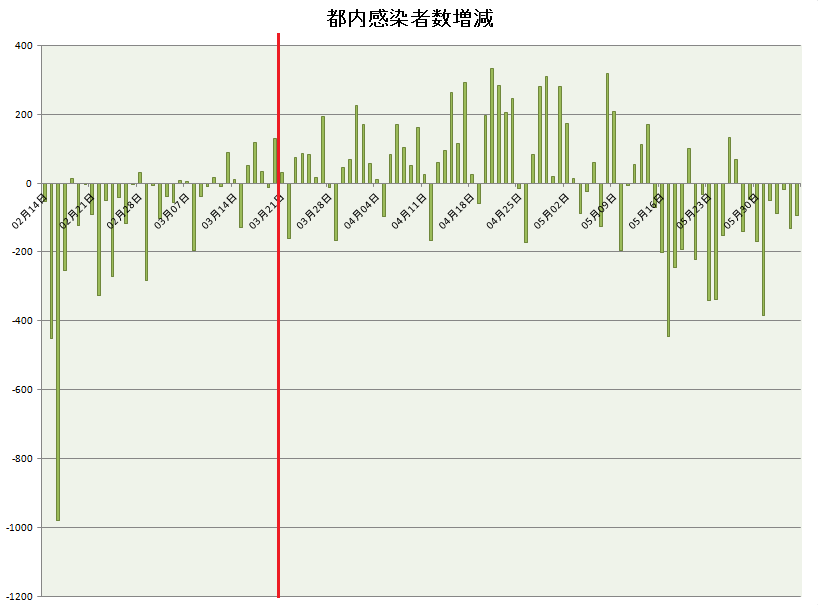
The number of infected people on a daily basis began to increase roughly around the red line (late March), but the number of medical treatment people continued to increase from that point until the end of Golden Week, but after that, it seems that the number of COVID-19 patients in Tokyo has decreased since the end of Golden Week!
↑ was the “increase / decrease” of COVID-19 patients in Tokyo, but the actual “number” of COVID-19 patients in Tokyo looks like this ↓
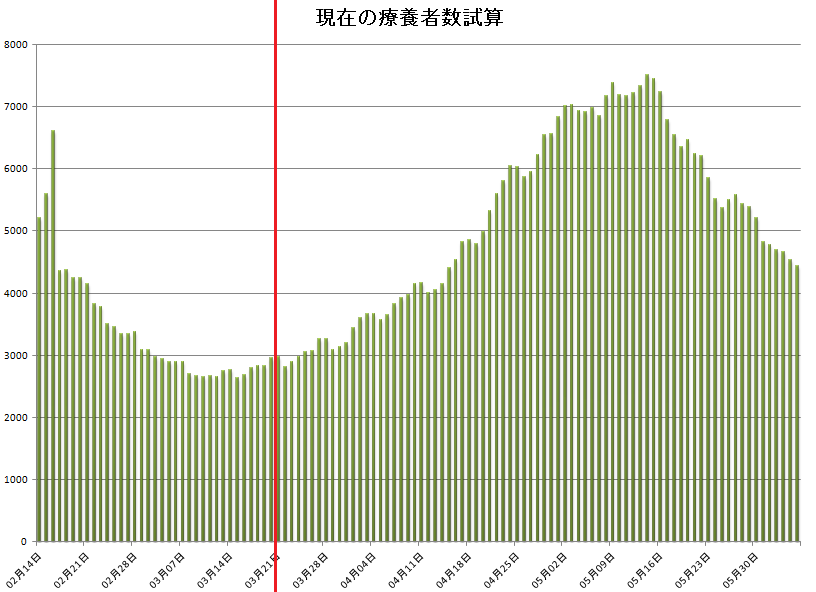
↑It seems that the number of COVID-19 patients in Tokyo has increased to about 7,000 at MAX …
And now it seems that the number has decreased to a little over 4000, but 4000 is still too many …
By the way, out of the “Number of COVID-19 patients in Tokyo”, the number of home care recipients, the number of accommodation care recipients, and the number of inpatients are like this … ↓
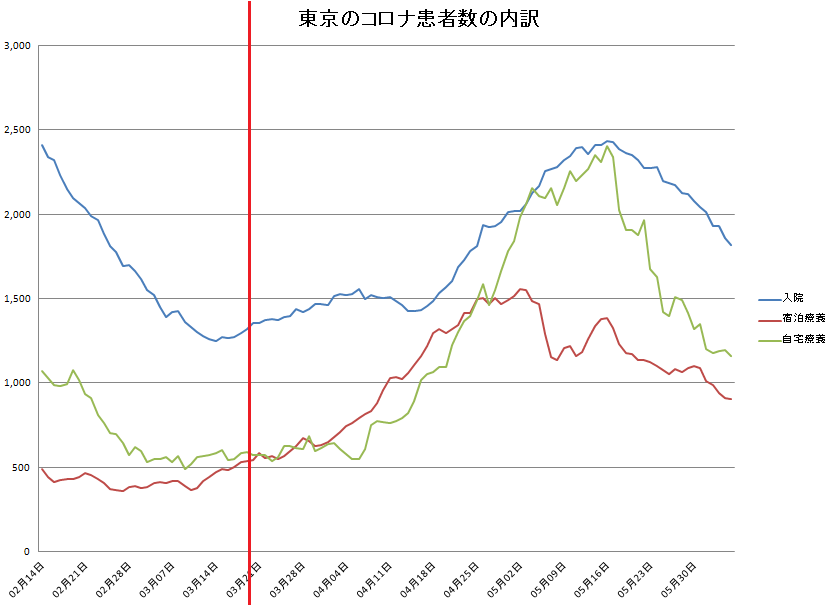
↑After all, it seems that the number of home care recipients will increase especially as the number of infected people increases …
By the way, the number of accommodation facilities for COVID-19 patients in Tokyo is close to 5,000 rooms, but
considering that the number of people receiving medical treatment at private accommodations has increased to only about 1500 at MAX, Tokyo is really wasting money …
Today, I summarized “the infection situation and transition of the 4th wave of Tokyo” like that!
Looking at it again … I’m really glad that it exceeded the peak …!
And this article↓
How long time the materials such as paper, cloth, plastic, etc. need to eliminating the risk when coronavirus is attached, and how effective disinfection is.
If you are interested, please take a look!
And here’s a trial calculation of how many people in Japan are actually receiving medical treatment.
(Number of people infected nationwide) 764,497
+ (Number of hospital discharges ) 13,673
+ (Number of hospital discharges ) 707,303
= 43,521 people ( -1,920) ← being treated
*()=increase from the day before
(If it is exactly as announced)
For those who are undergoing medical treatment nationwide are…
there are many days when the numbers increase this week too …
Today I tried to graph the number of infected people in Tokyo, but in the 4th wave this time, the daily number of infected people did not exceed 1000 people at the maximum, but if it’s going to increase like the 3rd wave, it’s too scary …
I don’t want to see the “mountain” shape appearing in such a graph again!
Please be careful when you go out!
AcertainFox512
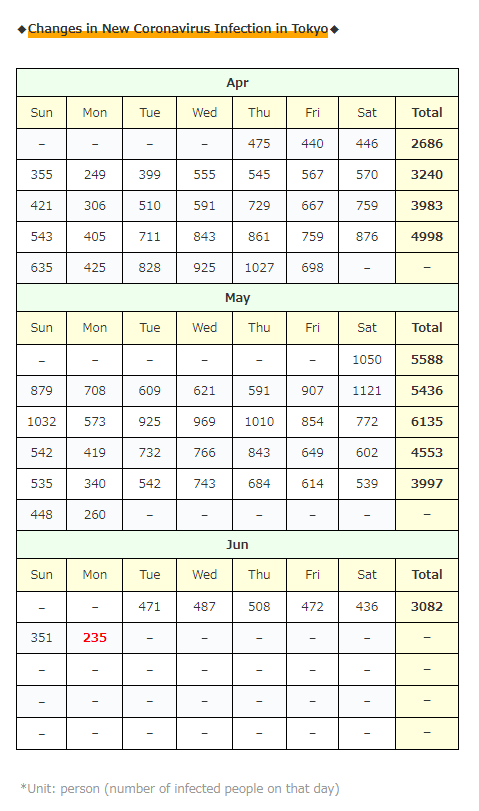
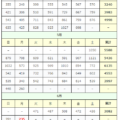
◆Changes in New Coronavirus Infection in Tokyo◆
| Apr | |||||||
| Sun | Mon | Tue | Wed | Thu | Fri | Sat | Total |
| – | – | – | – | 475 | 440 | 446 | 2686 |
| 355 | 249 | 399 | 555 | 545 | 567 | 570 | 3240 |
| 421 | 306 | 510 | 591 | 729 | 667 | 759 | 3983 |
| 543 | 405 | 711 | 843 | 861 | 759 | 876 | 4998 |
| 635 | 425 | 828 | 925 | 1027 | 698 | – | – |
| May | |||||||
| Sun | Mon | Tue | Wed | Thu | Fri | Sat | Total |
| – | – | – | – | – | – | 1050 | 5588 |
| 879 | 708 | 609 | 621 | 591 | 907 | 1121 | 5436 |
| 1032 | 573 | 925 | 969 | 1010 | 854 | 772 | 6135 |
| 542 | 419 | 732 | 766 | 843 | 649 | 602 | 4553 |
| 535 | 340 | 542 | 743 | 684 | 614 | 539 | 3997 |
| 448 | 260 | – | – | – | – | – | – |
| Jun | |||||||
| Sun | Mon | Tue | Wed | Thu | Fri | Sat | Total |
| – | – | 471 | 487 | 508 | 472 | 436 | 3082 |
| 351 | 235 | – | – | – | – | – | – |
| – | – | – | – | – | – | – | – |
| – | – | – | – | – | – | – | – |
| – | – | – | – | – | – | – | – |
*Unit: person (number of infected people on that day)

コメント