
*** This article is written with the help of Google Translate… ***
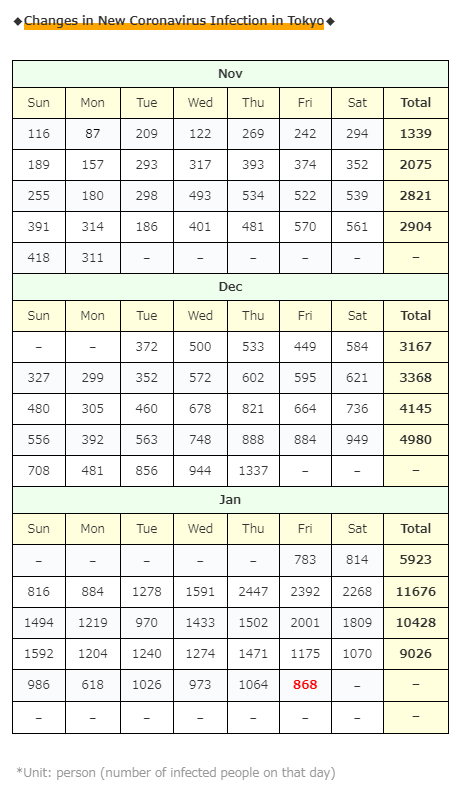
868 ( -196 from the day before) new infections confirmed in Tokyo.
◆◆◆ Japan ◆◆◆
(Today)
Number of people infected nationwide : 3,534 ( +599)
Number of people deaths nationwide : 96 ( -15)
Number of people infected in Tokyo : 868 ( -196)
*( )= increase from the day before
(Cumulative)
Number of people infected nationwide : 384,670 ( +3,531)
Number of people deaths nationwide : 5,610 ( +96)
Number of hospital discharges : 320,907 ( +5,814)
*( )= increase from the day before
* Since revisions are made daily by local governments and the media,
the cumulative total may differ from the new figures for the day.
Number of seriously ill persons nationwide : 1,014 ( -18)
(Other)
Narita Airport Quarantine : 4 ( -1 / Total 2,301)
*( )= increase from the day before
(Cumulative) * The following is up to 10 worst prefectures.
▽東京都 (Tokyo) 98,439人 (前日+ 868人)
▽大阪府 (Osaka) 43,170人 (前日+ 346人)
▽神奈川県 (Kanagawa) 39,974人 (前日+ 385人)
▽埼玉県 (Saitama) 24,640人(前日+256人)
▽愛知県 (Aichi) 23,800人 (前日+ 164人)
▽千葉県 (Chiba) 21,772人 (前日+ 339人)
▽北海道 (Hokkaido) 17,236人 (前日+ 111人)* Has it passed the peak?
▽兵庫県 (Hyogo) 16,220人 (前日+ 161人)
▽福岡県 (Fukuoka) 15,895人 (前日+159人)
▽京都府 (Kyoto) 8,289人 (前日+ 89人)
*( )= increase from the day before
(*All of the above from 2021/01/29 21:05 / NHK NEWS WEB)
◆◆◆ World ◆◆◆
(Cumulative)
Number of people infected nationwide : 102,110,605 ( +589,934)
Number of people deaths nationwide : 2,202,672 ( +16,239)
Number of hospital discharges : 73,961,553 ( +529,541)
( All of the above from 2021/01/29 19:20 / worldometers)
*( )= increase from the day before
The number of newly infected people in Tokyo has decreased from the previous day’s Thursday for the second consecutive week!
The recent trend is really “I don’t understand!”
Meanwhile… How about the amount of people in the city in Tokyo…
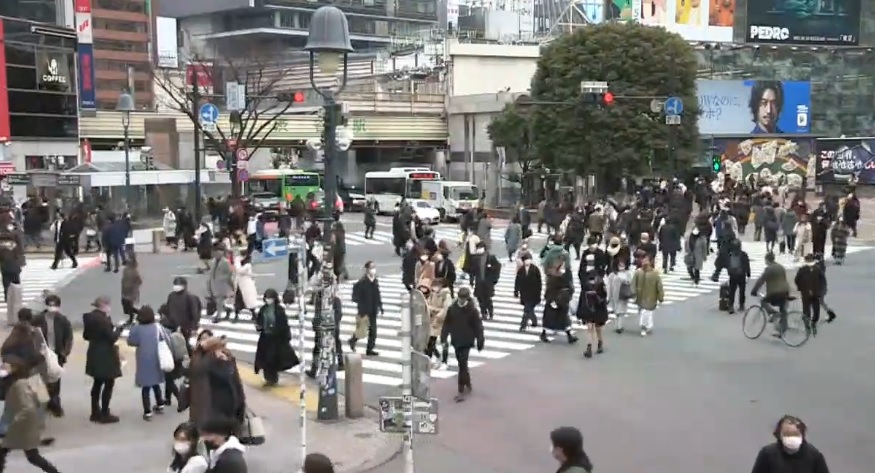
(Around 15:00 on January 29th, Shibuya Scramble Crossing, Tokyo)
Well, I will summarize
the breakdown of the number of new infections in Tokyo + α …!
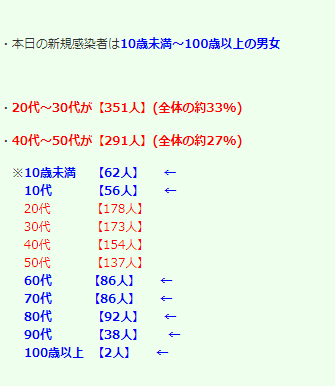
Out of [868] new infections in Tokyo
・Today’s newly infected people are men and women in their under10 to over100
・[314] people is in their 20s to 30s
(about 36% of the total)
・[231] people is in their 40s to 50s
(about 26% of the total)
*under10 : [20] persons ←
*10s : [41] persons ←
*20s : [172] persons
*30s : [142] persons
*40s : [1112] persons
*50s : [119] persons
*60s : [82] persons ←
*70s : [79] persons ←
*80s : [71] persons ←
*90s : [31] persons ←
*over100 : [1] persons ←
・ [N/A] people is
in 『the entertainment district at night』
→Employees and guests such as host clubs and cabaret clubs
・Infection at home [213] people
・Infection at office [26] people
・Infection at a dinner with friends and acquaintances [9] people
・Infection in the facility [159] people
・Infection via other routes [N/A] people
* Infection in the facility [159] people
[25] medical institutions, [60] people
+ [34] facilities for the elderly, [62] people
*Bed usage rate: 61.8% (←61.4%)
for severely ill people: 55.5% (←56.6%)
*( )= Number of the previous day
(As of Jan 29)
(Individual infection information)
* Overseas travel history [1 person] → America
(Outbreak information)
・ I couldn’t confirm the information today …
*** Information on people under medical treatment in Tokyo ***
Number of hospitalized : 2,903 ( +15)
Number of seriously ill : 147 ( -3)
Home medical treatment : 5,816 ( -784)
Hotel medical treatment : 693 ( -34)
Adjusting for “hospitalization or hotel or home treatment” : 4,395 ( -415)
People discharged from hospital or
those who have completed medical treatment at home: 83,768 ( +2,001)
*( )= increase from the day before
Net increase in infected people in Tokyo
= (Number of new infections)
- (Number of people who completed medical treatment)
- (Number of deaths)
= 868 - 2,001 - 17
= -1,150 people
Estimated total number of infected people in Tokyo as of today
= (Number of positives)
- (end of medical treatment period such as discharge)
- (Number of deaths)
= 98,439 - 83,768 - 864
= 13,807 people
*Tokyo currently has 10 facilities for infected people
(Capacity of 2490 people)
* A hospital in Tokyo has secured 3280 beds (+220 beds for critically ill patients).
→ Aim to secure 3750 beds (+250 beds for critically ill patients).
* In addition, we will open two specialized hospitals from September to October, and plan to add another 200 beds.
*The hotels are that,
“the b Ikebukuro”, “DayniceHOTEL Tokyo”,
“Toyoko INN Shinjukukabukicho”, “Toyoko INN Tokyo Station Shinoohashimae”
“Shinagawa Prince Hotel (East Tower)”,
“Apa Hotel Asakusa Taharamachi Ekimae”
“Tokyo Toranomon Tokyu REI Hotel”
“Toyoko Inn Fuchu Nanbu Line Minamitama Station”
“APA Hotel & Resort Nishi-Shinjuku 5-chome Station Tower”
“Tokyo Pet-accompanied accommodation facility”
*The source of the total number of infected persons is from 東京都
■ Of today’s number of infected people [868] …
・Rich contacts [437] people
(about 50% of the total)
・Unknown infection route [430] people
(about 50% of the total)
・Overseas travel history holder [1] person(s)
* Bringing in samples from outside of Tokyo [40 cases]
・Quarantine at the airport
| Case study | Response (arrival date) |
Age | gender | residence | Behavior history | Symptom |
| 2127 | Kansai International Airport (1/28) |
50s | Female | Osaka | Philippines | Asymptomatic |
| 2128 | Narita (1/28) |
30s | male | Tokyo | United States of America | Asymptomatic |
| 2129 | Haneda (1/29) |
20’s | male | Kanagawa Prefecture | United States of America | Asymptomatic |
| 2130 | Narita (1/29) |
20’s | Female | Osaka | Nepal | Asymptomatic |
*From the website of the Ministry of Health, Labor and Welfare
・Mutants are still found today …
| No | Age | sex | residence | Symptoms / progress | Remarks |
| 1 | 20’s | male | Saitama | 1/19 Onset Late January Admitted to a medical institution in the prefecture |
・ Contact with No. 1 patient announced on 1/25 ・ No history of stay in the UK ・ No contact with an unspecified number of people |
| 2 | 30s | Female | Saitama | 1/19 Onset Late January Admitted to a medical institution in the prefecture |
・ Contact with No. 1 patient announced on 1/25 ・ No history of stay in the UK ・ No contact with an unspecified number of people |
| 3 | 30s | male | Saitama | 1/20 Onset Late January Admitted to a medical institution in the prefecture |
・ Contact with No. 1 patient announced on 1/25 ・ No history of stay in the UK ・ No contact with an unspecified number of people |
From the website of the Ministry of Health, Labor and Welfare
*Since the number of new infections in Tokyo seems to be almost the number of the previous day,
(Because the deadline for the number of new infections on the day is from 9:00 am the day before to 9:00 am on the day)
And also today, I will summarize some prefectures that have a high number of infected people, not just in the Tokyo area.
*** Saitama ***
・New infections are [256] people
→Saitama City [171] person(s)
Kawaguchi City [23] person(s)
Koshigaya City [23] person(s)
Kawagoe City [7] person(s)
Other municipalities [171] person(s)
(Individual infection information)
・ “Yume-no-en Rifure Urawa”, a day-care facility in Saitama City
*Today [1] person(s) / Cumulative [17] person(s)
・”Gyoda Central General Hospital” in Gyoda City
*Today [1] person(s) / Cumulative [65] person(s)
・”Ouchi Internal Medicine Neurology Hospital” in Misato City
*Today [2] person(s) / Cumulative [82] person(s)
* I’m sorry, but the number of people in Saitama by region comes out, but the details are often late or not come out on the day …
*** Kanagawa ***
・New infections are [385] people
・Rich contacts [210] people
・Unknown infection route [175] people
(Individual infection information)
・”Yokosuka City Uwamachi Hospital”
*Today [3] person(s)
2nd floor ward*Today [3] person(s) / Cumulative [26] person(s)
5th floor ward*Today [0] person(s) / Cumulative [26] person(s)
5th floor ward*Today [0] person(s) / Cumulative [7] person(s)
7th floor ward*Today [0] person(s) / Cumulative [8] person(s)
6th floor ward*Today [0] person(s) / Cumulative [6] person(s)
Other*Today [0] person(s) / Cumulative [N/A] person(s)
*Well … I think that it’s the second cluster …
*It has been cluster-certified in three places in one hospital, but I think that it has already spread throughout the hospital …
・Hospital in Chigasaki City
*Today [4] person(s) / Cumulative [31] person(s)
・Facilities for the elderly in Kawasaki City
*Today [2] person(s) / Cumulative [38] person(s)
*Among the infected people counted today, there are [11] cluster relationships, including the above.. (Other than the above, add 4 or less each)
*** Chiba ***
・New infections are [258] people
(Individual infection information)
* Details have not been clarified, but it is said that a new cluster has occurred at “Chiba University Hospital” …
* Tokyo Disneyland in Urayasu City will close the park one hour ahead of schedule to prevent infection with the new coronavirus. (9 pm → 8 pm)
*** Osaka ***
・New infections are [346] people
・ I couldn’t confirm the information today …
*** Aichi ***
・New infections are [164] people
→Nagoya City [52] people
*** Okinawa ***
・New infections are [63] people
→US military base:[2] person(s)
*Cumulative 909 US military personel
*Not included in the number of infected people in Okinawa
*** Fukuoka ***
・New infections are [159] person(s)
→Fukuoka City [60] people
→Kitakyushu City [20] people
(Individual infection information)
・Long-term care health facility “Shinwaen” in Kitakyushu City
*Today [1] person(s) / Cumulative [36] person(s)
* Although the number of infected people in Fukuoka City is mostly in Fukuoka Prefecture, information on outbreaks in Fukuoka City does not come out much on the day …
◆◆◆ Hokkaido ◆◆◆
・New infections are [111] person(s)
→Sapporo City [60] people
(Individual infection information)
・”Hokkaido Social Business Association Otaru Hospital” in Otaru City
*Today [5] person(s) / Cumulative [27] person(s)
・”Sapporo Okadama High School” in Sapporo City
*Today [15] person(s) / Cumulative [27] person(s)
*Among the infected people counted today, there are [5] cluster relationships, including the above.. (Other than the above, add 2 or less each)
* In Hokkaido, outbreaks are rarely known on the day of the outbreak, and since it will be revealed and announced the next day or later, the cumulative number of people will be announced instead of the number on the day of the outbreak.
◆◆◆ Hyogo ◆◆◆
・New infections are [161] person(s)
(Individual infection information)
・”Takarazuka City Hospital”
*Today [N/A] person(s) / Cumulative [8] person(s)
◆◆◆ Kyoto ◆◆◆
・New infections are [89] person(s)
(Individual infection information)
・ I couldn’t confirm the information today …
* Others At this time (20:30), it seems that more than 10 people have been confirmed to be infected in the following areas …
▽ Hiroshima prefecture has 4764 people (34)
▽ Ibaraki Prefecture has 4686 people (86)
▽ Shizuoka Prefecture has 4526 people (38)
▽ Gifu prefecture has 4073 people (27)
▽ Gunma Prefecture has 3775 people (41)
▽ Tochigi Prefecture has 3731 people (44)
▽ Miyagi Prefecture has 3369 people (13)
▽ Kumamoto Prefecture has 3318 people (19)
▽ Nara Prefecture has 2925 people (30)
▽ 2315 people (12) in Okayama prefecture
▽ Nagano Prefecture has 2268 people (12)
▽ Mie Prefecture has 2146 people (17)
▽ Shiga Prefecture has 2097 people (30)
▽ Miyazaki Prefecture has 1804 people (14)
▽ Fukushima Prefecture has 1707 people (14)
▽ Kagoshima Prefecture has 1598 people (19)
▽ Nagasaki Prefecture has 1492 people (18)
▽ Yamaguchi Prefecture has 1204 people (14)
▽ Oita Prefecture has 1135 people (20)
▽ Wakayama Prefecture has 1047 people (15)
▽ Niigata Prefecture * 899 people (11)
▽ Shimane Prefecture has 264 people (10)
* Today, there are too many prefectures where more than 10 people have been confirmed to be infected, so I have picked up information on outbreaks in areas where more than 50 people have been confirmed to be infected.
→I am picking up major cities because there are too many infection explosions…
*Graph of the number of newly infected people in Japan as of yesterday
(* This bar graph is up to the previous day, so today’s red bar (handwritten) is on the far right, but it’s about this …)
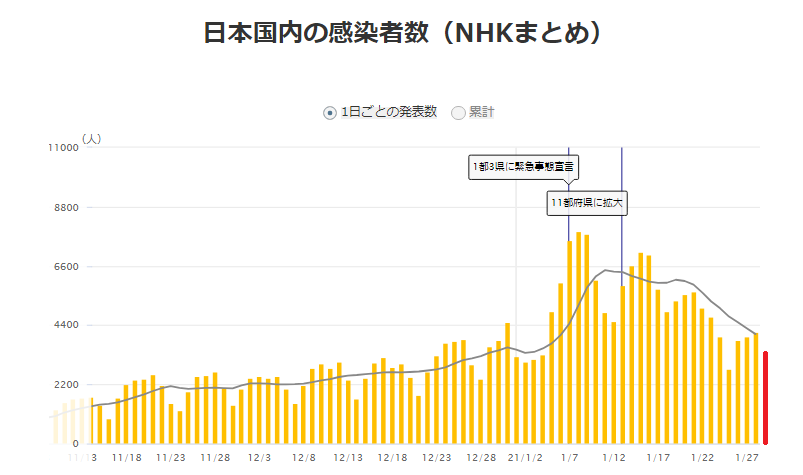
(*”Since the graph shows only the numbers up to the previous day, I handwritten the rightmost bar, but this is about it!”)
(*NHK NEWS WEB)
The state of emergency was reissued on Jan 7, and I summarized yesterday, but I think I’ll use it for a while (← I am easy to forget various things…lol), so I wrote another article about it!

↑It’s easy to summarize what will happen with the state of emergency and which industries and places will be requested to refrain from doing so!
It seems that the Brazilian mutant virus is more dangerous than I expected …!
The British mutant (70% increase in infectivity) has become a hot topic in Japan, but the South African mutant is said to be a little more powerful than that …!
(From the summary article on January 26)
And even more …!
The Brazilian mutant has the both characteristics of the British and South African mutants, and is stronger than the British and South African mutants …!
By the way, in Brazil, the home country of the mutant species …
・When the specimens were reexamined until November, there were no mutants.
・In December, 52.2% (more than half !?) were mutants.
・In Manaus, Brazil, 85% of this month’s samples examined are this mutant.
It’s too scary. .. .. ..
The characteristic of the virus is that the more the number of infections increases, the easier it is to mutate, but if it is mutated so much, it makes us a little scared that “the vaccine will not work before vaccination starts in Japan”…
And the topic changes, but …
I checked what I was a little worried about today!
I always introduce it like this in this “summary article” and the 15:00 bulletin on Twitter…
今日の東京の新規感染者数は【1064人】だそうです!
20代~30代の割合が下がり続けるのに対して
今日は10歳未満の感染がやけに多いですね…
集団感染でもあったのかな。。またあとで集計&詳細まとめます!#新型コロナウイルス #感染者数 #東京の感染者数 #東京1064人 #感染者数カレンダー #コロナ pic.twitter.com/W8f0TmWpiT
— acertainfox512 (@acertainfox512) January 28, 2021
I’ve introduced the infection status and rate by age, but there is no article summarizing it because major news sites don’t care about it …
Only the weekly average will be announced at the “Monitoring Conference” in Tokyo …
So!
I tried my best to put it together while I was short of breath! (Lol)
First of all, the number of infected people by age in the past month …!
<Number of infected people by age in January>
| date | TTL | Under 10 | 10s | 20s | 30s | 40s | 50s | 60s | 70s | 80s | 90s | 100 and over | 不明 | |
| 28日 | 木 | 1064 | 62 | 56 | 178 | 173 | 154 | 137 | 86 | 86 | 92 | 38 | 2 | 0 |
| 27日 | 水 | 973 | 23 | 42 | 193 | 160 | 144 | 146 | 87 | 78 | 77 | 19 | 4 | 0 |
| 26日 | 火 | 1026 | 27 | 45 | 189 | 164 | 145 | 142 | 96 | 95 | 86 | 35 | 2 | 0 |
| 25日 | 月 | 618 | 23 | 36 | 117 | 114 | 83 | 93 | 49 | 50 | 30 | 23 | 0 | 0 |
| 24日 | 日 | 986 | 23 | 41 | 191 | 143 | 125 | 148 | 101 | 90 | 88 | 33 | 3 | 0 |
| 23日 | 土 | 1070 | 29 | 71 | 206 | 136 | 180 | 154 | 88 | 86 | 80 | 36 | 4 | 0 |
| 22日 | 金 | 1175 | 34 | 63 | 223 | 172 | 173 | 159 | 114 | 98 | 103 | 32 | 4 | 0 |
| 21日 | 木 | 1471 | 53 | 73 | 300 | 241 | 196 | 222 | 173 | 92 | 83 | 36 | 2 | 0 |
| 20日 | 水 | 1274 | 40 | 73 | 272 | 213 | 211 | 163 | 118 | 77 | 67 | 39 | 1 | 0 |
| 19日 | 火 | 1240 | 28 | 60 | 282 | 211 | 192 | 186 | 104 | 92 | 69 | 16 | 0 | 0 |
| 18日 | 月 | 1204 | 32 | 68 | 303 | 206 | 199 | 130 | 96 | 71 | 58 | 41 | 0 | 0 |
| 17日 | 日 | 1592 | 47 | 86 | 362 | 315 | 258 | 213 | 122 | 117 | 56 | 16 | 0 | 0 |
| 16日 | 土 | 1809 | 65 | 97 | 379 | 302 | 294 | 268 | 152 | 123 | 95 | 33 | 1 | 0 |
| 15日 | 金 | 2001 | 65 | 108 | 458 | 355 | 303 | 297 | 152 | 132 | 99 | 30 | 2 | 0 |
| 14日 | 木 | 1502 | 48 | 100 | 379 | 293 | 214 | 207 | 113 | 82 | 51 | 15 | 0 | 0 |
| 13日 | 水 | 1433 | 25 | 95 | 394 | 275 | 202 | 198 | 101 | 70 | 61 | 12 | 0 | 0 |
| 12日 | 火 | 970 | 23 | 54 | 249 | 184 | 128 | 138 | 76 | 70 | 37 | 11 | 0 | 0 |
| 11日 | 月 | 1219 | 37 | 72 | 356 | 204 | 183 | 177 | 75 | 58 | 39 | 18 | 0 | 0 |
| 10日 | 日 | 1494 | 39 | 104 | 403 | 261 | 236 | 201 | 105 | 69 | 50 | 25 | 1 | 0 |
| 9日 | 土 | 2268 | 56 | 132 | 654 | 437 | 337 | 302 | 151 | 117 | 64 | 17 | 1 | 0 |
| 8日 | 金 | 2392 | 46 | 141 | 711 | 536 | 340 | 298 | 143 | 115 | 42 | 19 | 1 | 0 |
| 7日 | 木 | 2447 | 53 | 128 | 666 | 552 | 408 | 303 | 143 | 98 | 76 | 18 | 2 | 0 |
| 6日 | 水 | 1591 | 42 | 66 | 439 | 326 | 278 | 196 | 111 | 82 | 38 | 13 | 0 | 0 |
| 5日 | 火 | 1278 | 25 | 70 | 356 | 256 | 205 | 163 | 72 | 73 | 48 | 10 | 0 | 0 |
| 4日 | 月 | 884 | 14 | 44 | 241 | 181 | 147 | 124 | 60 | 38 | 23 | 10 | 2 | 0 |
| 3日 | 日 | 816 | 22 | 37 | 214 | 182 | 116 | 123 | 52 | 39 | 26 | 5 | 0 | 0 |
| 2日 | 土 | 814 | 20 | 35 | 213 | 137 | 138 | 118 | 59 | 42 | 34 | 18 | 0 | 0 |
| 1日 | 金 | 783 | 14 | 30 | 234 | 143 | 132 | 104 | 59 | 31 | 25 | 11 | 0 | 0 |
(*The table is based on the data from 東京都福祉保健局)
Yeah, despite trying hard, but perhaps you think “I don’t know what is this mean … I don’t understand …”, right?
I’m so sad! Lol
However, I will make some changes based on this data …!
<Infection rate by age in January>
| Date | TTL | Under 10 | 10s | 20s | 30s | 40s | 50s | 60s | 70s | 80s | 90s | 100 and over | Unknown | |
| 28日 | 木 | 1064 | 5.8% | 5.3% | 16.7% | 16.3% | 14.5% | 12.9% | 8.1% | 8.1% | 8.6% | 3.6% | 0.2% | 0.0% |
| 27日 | 水 | 973 | 2.4% | 4.3% | 19.8% | 16.4% | 14.8% | 15.0% | 8.9% | 8.0% | 7.9% | 2.0% | 0.4% | 0.0% |
| 26日 | 火 | 1026 | 2.6% | 4.4% | 18.4% | 16.0% | 14.1% | 13.8% | 9.4% | 9.3% | 8.4% | 3.4% | 0.2% | 0.0% |
| 25日 | 月 | 618 | 3.7% | 5.8% | 18.9% | 18.4% | 13.4% | 15.0% | 7.9% | 8.1% | 4.9% | 3.7% | 0.0% | 0.0% |
| 24日 | 日 | 986 | 2.3% | 4.2% | 19.4% | 14.5% | 12.7% | 15.0% | 10.2% | 9.1% | 8.9% | 3.3% | 0.3% | 0.0% |
| 23日 | 土 | 1070 | 2.7% | 6.6% | 19.3% | 12.7% | 16.8% | 14.4% | 8.2% | 8.0% | 7.5% | 3.4% | 0.4% | 0.0% |
| 22日 | 金 | 1175 | 2.9% | 5.4% | 19.0% | 14.6% | 14.7% | 13.5% | 9.7% | 8.3% | 8.8% | 2.7% | 0.3% | 0.0% |
| 21日 | 木 | 1471 | 3.6% | 5.0% | 20.4% | 16.4% | 13.3% | 15.1% | 11.8% | 6.3% | 5.6% | 2.4% | 0.1% | 0.0% |
| 20日 | 水 | 1274 | 3.1% | 5.7% | 21.4% | 16.7% | 16.6% | 12.8% | 9.3% | 6.0% | 5.3% | 3.1% | 0.1% | 0.0% |
| 19日 | 火 | 1240 | 2.3% | 4.8% | 22.7% | 17.0% | 15.5% | 15.0% | 8.4% | 7.4% | 5.6% | 1.3% | 0.0% | 0.0% |
| 18日 | 月 | 1204 | 2.7% | 5.6% | 25.2% | 17.1% | 16.5% | 10.8% | 8.0% | 5.9% | 4.8% | 3.4% | 0.0% | 0.0% |
| 17日 | 日 | 1592 | 3.0% | 5.4% | 22.7% | 19.8% | 16.2% | 13.4% | 7.7% | 7.3% | 3.5% | 1.0% | 0.0% | 0.0% |
| 16日 | 土 | 1809 | 3.6% | 5.4% | 21.0% | 16.7% | 16.3% | 14.8% | 8.4% | 6.8% | 5.3% | 1.8% | 0.1% | 0.0% |
| 15日 | 金 | 2001 | 3.2% | 5.4% | 22.9% | 17.7% | 15.1% | 14.8% | 7.6% | 6.6% | 4.9% | 1.5% | 0.1% | 0.0% |
| 14日 | 木 | 1502 | 3.2% | 6.7% | 25.2% | 19.5% | 14.2% | 13.8% | 7.5% | 5.5% | 3.4% | 1.0% | 0.0% | 0.0% |
| 13日 | 水 | 1433 | 1.7% | 6.6% | 27.5% | 19.2% | 14.1% | 13.8% | 7.0% | 4.9% | 4.3% | 0.8% | 0.0% | 0.0% |
| 12日 | 火 | 970 | 2.4% | 5.6% | 25.7% | 19.0% | 13.2% | 14.2% | 7.8% | 7.2% | 3.8% | 1.1% | 0.0% | 0.0% |
| 11日 | 月 | 1219 | 3.0% | 5.9% | 29.2% | 16.7% | 15.0% | 14.5% | 6.2% | 4.8% | 3.2% | 1.5% | 0.0% | 0.0% |
| 10日 | 日 | 1494 | 2.6% | 7.0% | 27.0% | 17.5% | 15.8% | 13.5% | 7.0% | 4.6% | 3.3% | 1.7% | 0.1% | 0.0% |
| 9日 | 土 | 2268 | 2.5% | 5.8% | 28.8% | 19.3% | 14.9% | 13.3% | 6.7% | 5.2% | 2.8% | 0.7% | 0.0% | 0.0% |
| 8日 | 金 | 2392 | 1.9% | 5.9% | 29.7% | 22.4% | 14.2% | 12.5% | 6.0% | 4.8% | 1.8% | 0.8% | 0.0% | 0.0% |
| 7日 | 木 | 2447 | 2.2% | 5.2% | 27.2% | 22.6% | 16.7% | 12.4% | 5.8% | 4.0% | 3.1% | 0.7% | 0.1% | 0.0% |
| 6日 | 水 | 1591 | 2.6% | 4.1% | 27.6% | 20.5% | 17.5% | 12.3% | 7.0% | 5.2% | 2.4% | 0.8% | 0.0% | 0.0% |
| 5日 | 火 | 1278 | 2.0% | 5.5% | 27.9% | 20.0% | 16.0% | 12.8% | 5.6% | 5.7% | 3.8% | 0.8% | 0.0% | 0.0% |
| 4日 | 月 | 884 | 1.6% | 5.0% | 27.3% | 20.5% | 16.6% | 14.0% | 6.8% | 4.3% | 2.6% | 1.1% | 0.2% | 0.0% |
| 3日 | 日 | 816 | 2.7% | 4.5% | 26.2% | 22.3% | 14.2% | 15.1% | 6.4% | 4.8% | 3.2% | 0.6% | 0.0% | 0.0% |
| 2日 | 土 | 814 | 2.5% | 4.3% | 26.2% | 16.8% | 17.0% | 14.5% | 7.2% | 5.2% | 4.2% | 2.2% | 0.0% | 0.0% |
| 1日 | 金 | 783 | 1.8% | 3.8% | 29.9% | 18.3% | 16.9% | 13.3% | 7.5% | 4.0% | 3.2% | 1.4% | 0.0% | 0.0% |
Is it getting a little easier to see?
But it still feels like “it’s hard to understand …” …, right?
So I tried my best! Lol
(The graph below is the one I want you to see the most …! )
<Infection rate by age in January>
| Date |
TTL |
Under 20 | 20s-30s | 40s-50s | 60s and over | |
| 28日 | 木 | 1064 | 11.1% | 33.0% | 27.3% | 28.6% |
| 27日 | 水 | 973 | 6.7% | 36.3% | 29.8% | 27.2% |
| 26日 | 火 | 1026 | 7.0% | 34.4% | 28.0% | 30.6% |
| 25日 | 月 | 818 | 9.5% | 37.4% | 28.5% | 24.6% |
| 24日 | 日 | 986 | 6.5% | 33.9% | 27.7% | 31.9% |
| 23日 | 土 | 1070 | 9.3% | 32.0% | 31.2% | 27.5% |
| 22日 | 金 | 1175 | 8.3% | 33.6% | 28.3% | 29.9% |
| 21日 | 木 | 1471 | 8.6% | 36.8% | 28.4% | 26.2% |
| 20日 | 水 | 1274 | 8.9% | 38.1% | 29.4% | 23.7% |
| 19日 | 火 | 1240 | 7.1% | 39.8% | 30.5% | 22.7% |
| 18日 | 月 | 1204 | 8.3% | 42.3% | 27.3% | 22.1% |
| 17日 | 日 | 1592 | 8.4% | 42.5% | 29.6% | 19.5% |
| 16日 | 土 | 1809 | 9.0% | 37.6% | 31.1% | 22.3% |
| 15日 | 金 | 2001 | 8.6% | 40.6% | 30.0% | 20.7% |
| 14日 | 木 | 1502 | 9.9% | 44.7% | 28.0% | 17.4% |
| 13日 | 水 | 1433 | 8.4% | 46.7% | 27.9% | 17.0% |
| 12日 | 火 | 970 | 7.9% | 44.6% | 27.4% | 20.0% |
| 11日 | 月 | 1219 | 8.9% | 45.9% | 29.5% | 15.6% |
| 10日 | 日 | 1494 | 9.6% | 44.4% | 29.3% | 16.7% |
| 9日 | 土 | 2268 | 8.3% | 48.1% | 28.2% | 15.4% |
| 8日 | 金 | 2392 | 7.8% | 52.1% | 26.7% | 13.4% |
| 7日 | 木 | 2447 | 7.4% | 49.8% | 29.1% | 13.8% |
| 6日 | 水 | 1591 | 6.8% | 48.1% | 29.8% | 15.3% |
| 5日 | 火 | 1278 | 7.4% | 47.9% | 28.8% | 15.9% |
| 4日 | 月 | 884 | 6.6% | 47.7% | 30.7% | 15.0% |
| 3日 | 日 | 816 | 7.2% | 48.5% | 29.3% | 15.0% |
| 2日 | 土 | 814 | 6.8% | 43.0% | 31.4% | 18.8% |
| 1日 | 金 | 783 | 5.6% | 48.1% | 30.1% | 16.1% |
(* Red letters are the largest% of the generation)
How is it?!
By the way, the color on the 22nd is changed because it is “the day when the Tokyo Metropolitan Government reduced the follow-up survey of the infection route”.
(*「積極的疫学調査」を縮小 高齢者らの対応優先―東京都 – 時事通信)
(*調査対象を医療機関や高齢者施設などのみにして、それ以外は感染者の申告に任せる方針へ変更)
As I thought, the percentage of infected people in their 20s and 30s is getting lower and lower as we expected.
And on the contrary, the percentage of infected people in their 40s and 50s is surprisingly stable and unchanged …
And what I would like to pay attention to is that the percentage of infected people under the age of 20 and the percentage of infected people over the age of 60 are gradually increasing …!
Looking at the reactions on the internet and news sites, many people said, “Isn’t it because of the survey that prioritizes the elderly that the number of infected people is high now?”, but
if I take a look at it in a table, it seems that the changes in the follow-up survey from the 22nd are not so relevant, and tend to be long-lasting and consistent!
(The proportion of people in their 20s and 30s is decreasing, and the proportion of other generations is increasing)
What does this graph look like to you?
From my point of view …
It does not mean that “the proportion of people in their 20s to 30s has decreased = the number of people in their 20s to 30s has decreased”, but that the spread of infection has spread to “under 20s” and “60s and over”.
As the number of infected people continues to increase in those two generations, so it seems that the proportion of people in their 20s and 30s is just lower …
With that in mind, we might think of it as follows …
①The behavior of people in their 20s and 30s has not changed.
②The number of infected people in their 20s and 30s has not decreased.
③The current increase in the number of infected people in Tokyo has spread to the generation with a small number of infected people.
By the way, in Tokyo, Japan, where the infection has spread so widely, how much will the number of infected people decrease thanks to this emergency declaration !?!?
And this article↓
How long time the materials such as paper, cloth, plastic, etc. need to eliminating the risk when coronavirus is attached, and how effective disinfection is.
If you are interested, please take a look!
And here’s a trial calculation of how many people in Japan are actually receiving medical treatment.
(Number of people infected nationwide) 384,670
+ (Number of hospital discharges ) 5,610
+ (Number of hospital discharges ) 320,907
= 58,153 people ( -2,379) ← being treated
*()=increase from the day before
(If it is exactly as announced)
For those who are undergoing medical treatment nationwide are…
In Japan, the infection suddenly spread during the year-end and New Year holidays, but as those infected people approached the time of discharge, the total number of people who completed medical treatment began to decrease.
そういえばディズニーランドもかなり苦戦中のようですね…!
ディズニーリゾートを運営するオリエンタルランドの
去年4月~12月までの売り上げは
前の年より64%も減少したそうです…!
春は数カ月閉園してましたし、10月まで入場制限もかなり厳しかったですもんね…!
ただ逆に「普通通りにオープンしてればそんなに損益はない」
ってことなのかな?
そう考えるとディズニーってやっぱり強いですね!
私は実はお恥ずかしながら去年の冬あたりからの
「ディズニーにわか」ですが(笑)、
あーー大好きになった今の状態でディズニーめっちゃ行きたい!!
と発狂しそうです!笑
おもいっきり気持ちよく遊ぶためにも早くコロナを収束させたいですね!
Please be very careful when you go out!
AcertainFox512
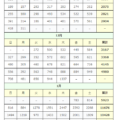
◆Changes in New Coronavirus Infection in Tokyo◆
| Nov | |||||||
| Sun | Mon | Tue | Wed | Thu | Fri | Sat | Total |
| 116 | 87 | 209 | 122 | 269 | 242 | 294 | 1339 |
| 189 | 157 | 293 | 317 | 393 | 374 | 352 | 2075 |
| 255 | 180 | 298 | 493 | 534 | 522 | 539 | 2821 |
| 391 | 314 | 186 | 401 | 481 | 570 | 561 | 2904 |
| 418 | 311 | – | – | – | – | – | – |
| Dec | |||||||
| Sun | Mon | Tue | Wed | Thu | Fri | Sat | Total |
| – | – | 372 | 500 | 533 | 449 | 584 | 3167 |
| 327 | 299 | 352 | 572 | 602 | 595 | 621 | 3368 |
| 480 | 305 | 460 | 678 | 821 | 664 | 736 | 4145 |
| 556 | 392 | 563 | 748 | 888 | 884 | 949 | 4980 |
| 708 | 481 | 856 | 944 | 1337 | – | – | – |
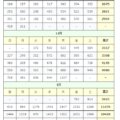
| Jan | |||||||
| Sun | Mon | Tue | Wed | Thu | Fri | Sat | Total |
| – | – | – | – | – | 783 | 814 | 5923 |
| 816 | 884 | 1278 | 1591 | 2447 | 2392 | 2268 | 11676 |
| 1494 | 1219 | 970 | 1433 | 1502 | 2001 | 1809 | 10428 |
| 1592 | 1204 | 1240 | 1274 | 1471 | 1175 | 1070 | 9026 |
| 986 | 618 | 1026 | 973 | 1064 | 868 | – | – |
| – | – | – | – | – | – | – | – |
*Unit: person (number of infected people on that day)
コメント