
*** This article is written with the help of Google Translate… ***
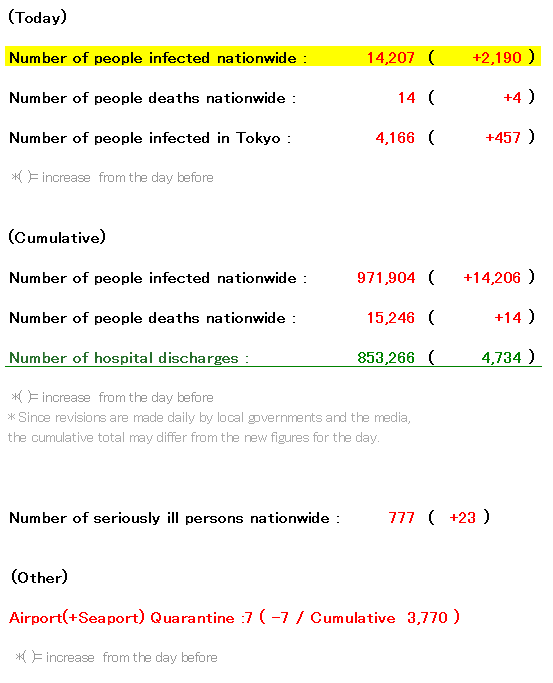
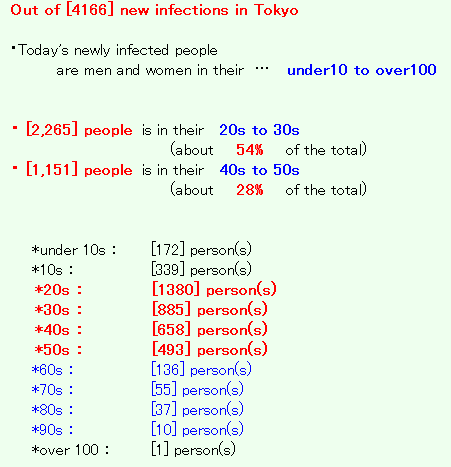
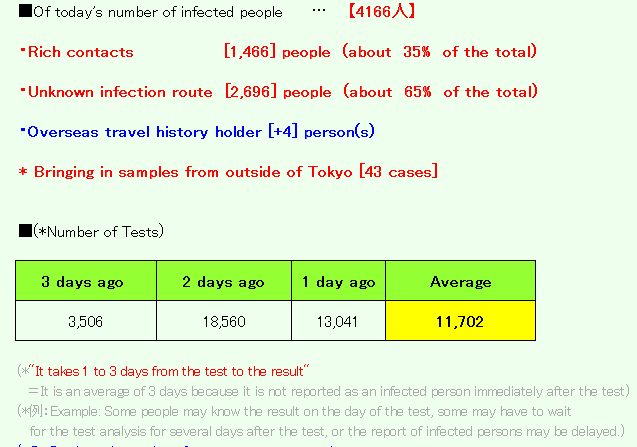
4166 ( +457 from the day before) new infections confirmed in Tokyo.
◆◆◆ Japan ◆◆◆
(Cumulative) * The following is up to 10 worst prefectures.
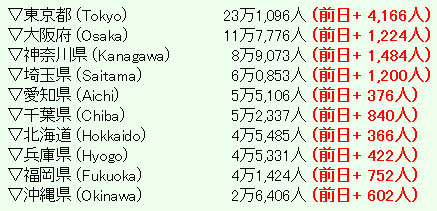
*( )= increase from the day before
(*All of the above from 2021/08/04 19:00 / NHK NEWS WEB)
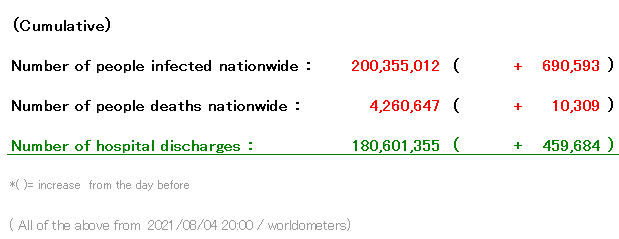
◆◆◆ World ◆◆◆
The number of infected people in Tokyo has reached a record high again …
With this, the scenario that “last week was the week after the holidays, so it just increased specially” (= it will decrease from this week) is gone …
It seems that the increase will continue …
Meanwhile… How about the amount of people in the city in Tokyo…↓
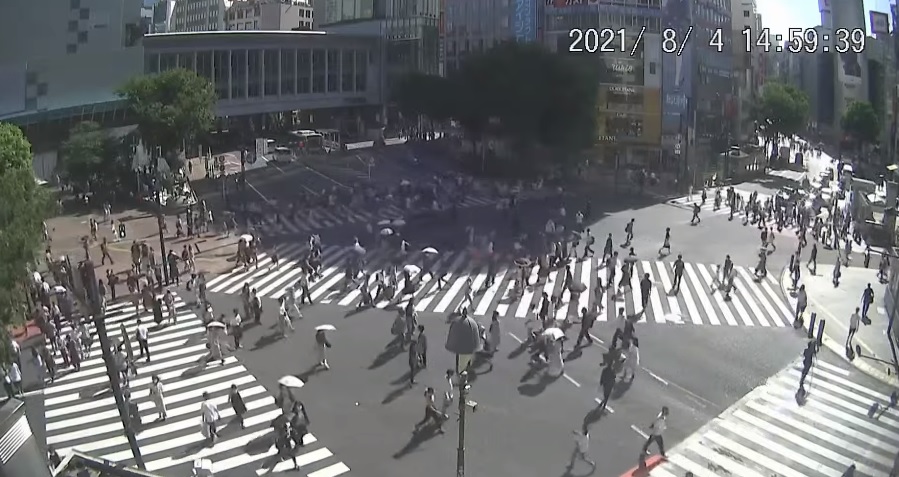
(Around 15:00 on Aug 03, Shibuya Scramble Crossing, Tokyo)
Well, I will summarize
the breakdown of the number of new infections in Tokyo + α …!
・ [N/A] people is
in 『the entertainment district at night』
→Employees and guests such as host clubs and cabaret clubs
・Infection at home [875] people
・Infection at office [239] people
・Infection in the facility [61] people
・Infection by eating out [43] people
・Infection via other routes [N/A] people
*Bed usage rate: 57.0% (←56.2%)
for severely ill people: 29.3% (←28.6%)
*( )= Number of the previous day
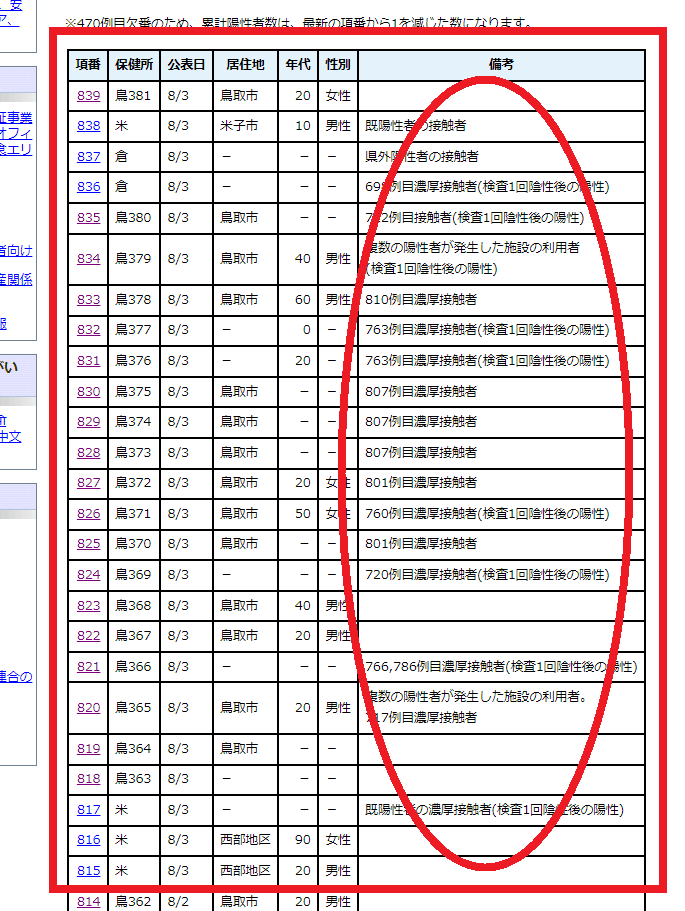
(Individual infection information)
・ Today, I was able to confirm only the information of several individual people …
*Tokyo currently has 12 facilities for infected people
(Capacity of 5,048 people)
* A hospital in Tokyo has secured 4716 beds (+332 beds for critically ill patients).
→ According to national standards, the number of beds for severe cases was 1024.
*The hotels are that,
“the b Ikebukuro”, “DayniceHOTEL Tokyo”,
“Toyoko INN Shinjukukabukicho”,
“Toyoko INN Tokyo Station Shinoohashimae”,
“Shinagawa Prince Hotel (East Tower)”,
“Apa Hotel Asakusa Taharamachi Ekimae”,
“Tokyo Toranomon Tokyu REI Hotel”,
“Toyoko Inn Fuchu Nanbu Line Minamitama Station”,
“APA Hotel & Resort Nishi-Shinjuku 5-chome Station Tower”,
“Tokyo Pet-accompanied accommodation facility”,
“APA Hotel Yamanote Otsuka Station Tower”,
“Toyoko Inn Ikebukuro North Exit II”
*The source of the total number of infected persons is from 東京都
・Quarantine at the airport
| Case study | Response (arrival date) |
age | sex | residence | Behavior history | Symptom |
| 3418 |
Narita (7/30) |
20’s | male | Undisclosed | Philippines | Asymptomatic |
| 3419 | Narita (7/30) |
50s | male | Undisclosed | Philippines | Asymptomatic |
| 3420 | Kansai International Airport (7/30) |
60s | male | Osaka | Philippines | Asymptomatic |
| 3421 | Narita (7/30) |
Forties | male | Tokyo | Korea | Asymptomatic |
| 3422 | Haneda (7/24) |
50s | male | Tokyo | Kyrgyzstan | Asymptomatic |
| 3423 | Narita (7/27) |
10’s | Woman | Shizuoka Prefecture | Indonesia | Asymptomatic |
| 3424 | Narita (7/27) |
30s | male | Toyama Prefecture | Indonesia | Asymptomatic |
| 3425 | Haneda (7/30) |
50s | male | Tokyo | United States of America | Asymptomatic |
| 3426 | Haneda (7/30) |
60s | male | Tokyo | United States of America | Asymptomatic |
| 3427 | Narita (7/30) |
30s | male | Hyogo prefecture | South Africa | Asymptomatic |
| 3428 | Haneda (7/30) |
Forties | male | Shizuoka Prefecture | United States of America | Asymptomatic |
| 3429 | Haneda (7/30) |
Under teens | male | Shizuoka Prefecture | United States of America | Asymptomatic |
| 3430 | Kansai International Airport (7/30) |
70s | Woman | Hyogo prefecture | Italy | Asymptomatic |
| 3431 | Haneda (7/31) |
30s | male | Tokyo | Russia | Asymptomatic |
*From the website of the Ministry of Health, Labor and Welfare
*Currently, Japan is refusing to enter from India, Nepal, and Pakistan in principle as a countermeasure against Indian variant stain.
*Since the number of new infections in Tokyo seems to be almost the number of the previous day,
(Because the deadline for the number of new infections on the day is from 9:00 am the day before to 9:00 am on the day)
And also today, I will summarize some prefectures that have a high number of infected people, not just in the Tokyo area.
*** Saitama ***
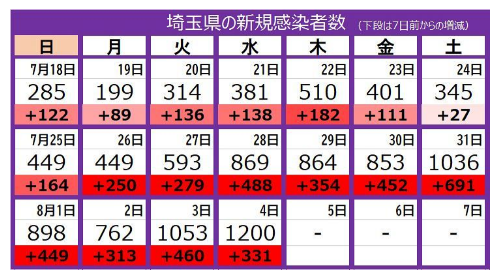
・New infections are [1200] people
■■■ The highest number of newly infected people ever ■■■
→Saitama City [290] person(s)
Kawaguchi City [142] person(s)
Koshigaya City [63] person(s)
Kawagoe City [53] person(s)
Other municipalities [652] person(s)
(*東京新聞)
* I’m sorry, but the number of people in Saitama by region comes out, but the details are often late or not come out on the day …
*** Kanagawa ***
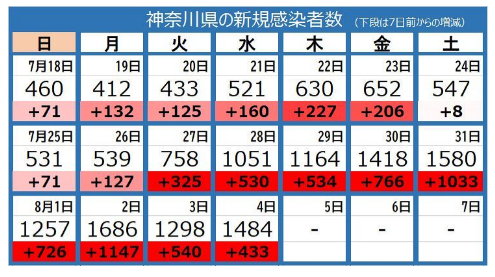
・New infections are [1484] people
・Rich contacts [-] people
・Unknown infection route [-] people
(*東京新聞)
(Individual infection information)
・Cram school in Kamakura jurisdiction
*Today [3] person(s) /Cumulative [35] person(s)
・”Ebina General Hospital” in Ebina City
*Today [4] person(s) / Cumulative [33] person(s)
*Among the infected people counted today, there are [7] cluster relationships, including the above… (Other than the above, add 3 or less each)
*** Chiba ***
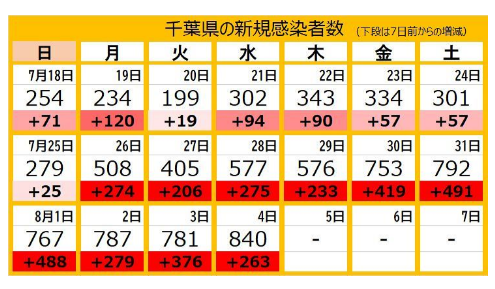
・New infections are [840] people
■■■ The highest number of newly infected people ever ■■■
(*東京新聞)
(Individual infection information)
・”Tateyama City Hall”
*Today [new] person(s) / Cumulative [5] person(s)
・Same club activities of “Chiba University of Commerce High School” in Ichikawa City
*Today [new] person(s) / Cumulative [8] person(s)
・Hospital in Chiba City
*Today [new] person(s) / Cumulative [14] person(s)
*12 out of 14 people have been vaccinated for the second time …
* Currently, in Chiba, cluster information is not coming out much again …
(I have the impression that they haven’t given much information since autumn)
*The following areas introduced until the other day will be excluded for a while.
①About “Osaka / Aichi / Okinawa / Hyogo / Kyoto”
→I have summarized this for the past year, but the details of the infection rarely appear during the day.
②About “Hokkaido”
→Infection is settling down
* Others At this time (20:00), it seems that more than 10 people have been confirmed to be infected in the following areas …
↓ Today, all areas other than “Worst 10”
▽ Kyoto Prefecture has 19,084 people (277)
▽ Ibaraki Prefecture has 13,321 people (290)
▽ Hiroshima prefecture has 12,416 people (114)
▽ Shizuoka Prefecture has 11,414 people (202)
▽ Miyagi Prefecture has 10,129 people (80)
▽ Gifu Prefecture has 9730 people (43)
▽ Gunma Prefecture has 9288 people (204)
▽ Nara Prefecture has 9183 people (89)
▽ Tochigi Prefecture has 8779 people (178)
▽ Okayama Prefecture has 8538 people (131)
▽ Kumamoto Prefecture has 7322 people (116)
▽ 6304 people (103) in Shiga prefecture
▽ Fukushima Prefecture has 6116 people (92)
▽ Mie Prefecture has 5972 people (74)
▽ Nagano Prefecture has 5475 people (61)
▽ Ishikawa Prefecture has 5444 people (118)
▽ Niigata Prefecture has 4235 people (78)
▽ Kagoshima Prefecture has 4108 people (44)
▽ Oita Prefecture has 3760 people (34)
▽ Nagasaki Prefecture has 3579 people (28)
▽ Yamaguchi Prefecture has 3351 people (27)
▽ Miyazaki Prefecture has 3322 people (29)
▽ Wakayama Prefecture has 3116 people (39)
▽ 3004 people (32) in Ehime prefecture
▽ Saga Prefecture has 2832 people (31)
▽ Aomori Prefecture has 2767 people (16)
▽ Yamanashi Prefecture has 2599 people (49)
▽ Kagawa Prefecture has 2390 people (27)
▽ Toyama Prefecture has 2371 people (31)
▽ Yamagata Prefecture has 2221 people (21)
▽ Kochi Prefecture has 2128 people (6)
▽ Iwate Prefecture has 2065 people (19)
▽ Tokushima Prefecture has 1822 people (11)
▽ Fukui Prefecture has 1736 people (28)
▽ Akita Prefecture has 1038 people (8)
▽ 872 people (34) in Tottori prefecture
▽ Shimane Prefecture has 763 people (4)
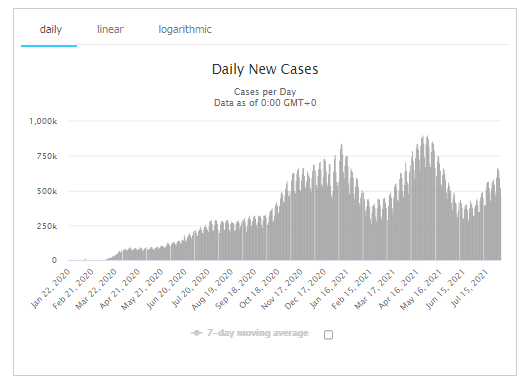
*Graph of the number of newly infected people in Japan as of yesterday
(* This bar graph is up to the previous day, so today’s red bar (handwritten) is on the far right, but it’s about this …)
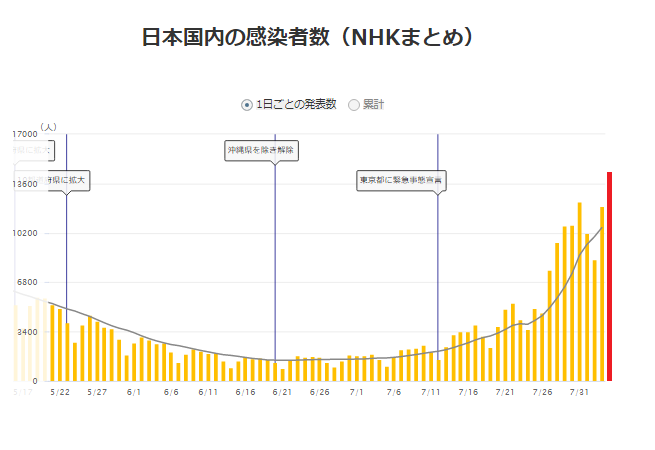
(*”Since the graph shows only the numbers up to the previous day, I handwritten the rightmost bar, but this is about it!”)
(*NHK NEWS WEB)
<Summary of today’s “Major News Related to COVID-19 in Japan”>
<Areas subject to “Emergency declaration” and “Priority measures such as prevention of spread”>
State of emergency
Target area : Tokyo / Okinawa
(Addition) Saitama, Kanagawa, Chiba, Osaka
Priority measures such as prevention of spread
Target area : (All areas up to now have been moved up to ↑)
(Addition) Hokkaido, Ishikawa, Hyogo, Kyoto, Fukuoka
●Period: August 2nd to August 31st
(* Ibaraki Prefecture is also considering applying the state of emergency *nhk)
→
*It seems that the above-mentioned Ibaraki Prefecture has issued a “prefecture-specific state of emergency” and requested the Japanese government to apply the declaration on August 3.
(*茨城県 独自の緊急事態宣言へ 国に宣言対象地域の追加要請も – NHK)
Nishimura, the minister in charge of economic revitalization, also said that, but …
Recently in Japan, the number of seriously ill people has not stopped increasing …
According to the article, “In the last 10 days, the number of people has increased by 300 to over 700.”
When you actually make a graph, it looks like this … ↓

↑ It’s true that the number is increasing at a steep angle …
The scary thing is that the peak is still ahead …
By the way, the number of deaths is currently in the form of a graph like this … ↓
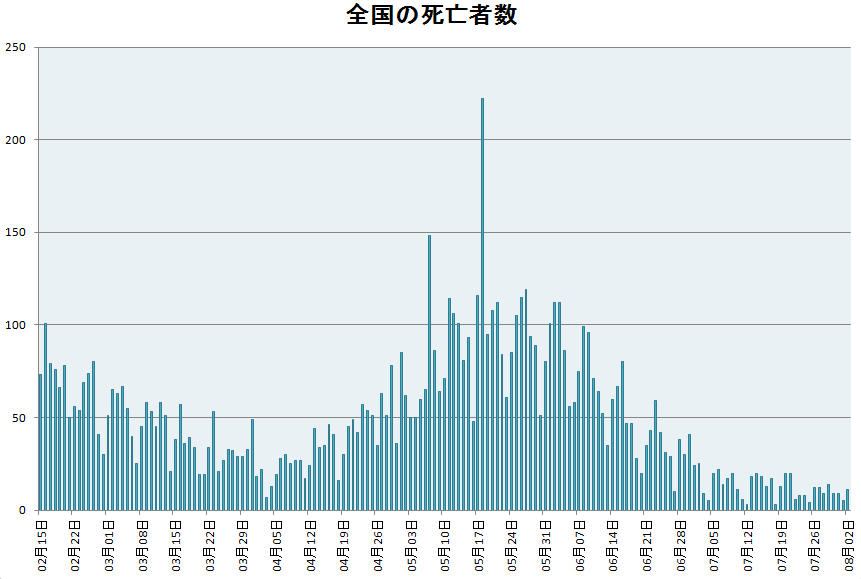
(↑*There are some strange sticks, but the resasons are below)
①May 7th, which seems to have been recorded collectively after GW (*NHK)
②May 18 of “Corrected for 121 people in Hyogo prefecture” (*NHK)
And when I show the transition of the number of infected people nationwide in the same graph form, it looks like this … ↓
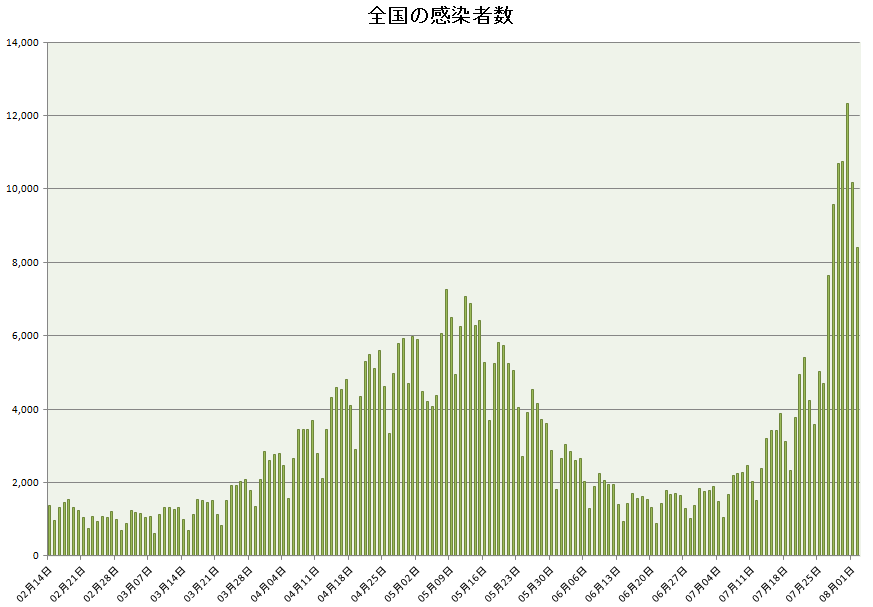
I have arranged three graphs now,
What you can see from the previous 4th wave …↓
①The peak number of infected people is from May 8th to 13th.
②The peak number of serious injuries is from May 26th to June 5th.
③The peak number of deaths is from May 25th to June 3rd.
Therefore, it can be seen that the number of deaths and the number of severely ill people will change 2-3 weeks after the change in the number of infected people …
The number of deaths in Japan has been low these days, and the government has been very cautious about it, but I’m wondering what the numbers are on August 16th (around the end of Obon) when three weeks after the outbreak of the fifth wave (currently) of infection on July 27…
… By the way, the extra analysis has become a little long today (dry laugh), so it’s easy to get two chunks of domestic and overseas news…
First domestic!
It seems that the largest cluster in Okinawa has ever occurred!
It seems that 140 people have been infected by August 3 yesterday in a cluster that occurred at a medical institution in Uruma City …
(129 out of 270 inpatients are infected, and the vaccination rate for inpatients is less than 10%)
The government will begin vaccination of AstraZeneca Vaccine in areas where a state of emergency has been declared!
| Prefecture | Amount(Times) |
| Tokyo | 579500 |
| Kanagawa | 390600 |
| Osaka | 357900 |
| Chiba | 305600 |
| Saitama | 258700 |
| Okinawa | 58000 |
It is intended for “people who have already completed the first vaccination with the AstraZeneca vaccine” and “people who are allergic to the ingredients of other vaccines”, and “in principle, do not inoculate under the age of 40”!
The spread of Tottori infection does not stop …!
Double-digit number of infected people every day …
↑It seems that the close contacts can still chase …
Under such circumstances, Iwate seems to be busy selling and using “Go To Eat” premium meal tickets… (dry laugh)
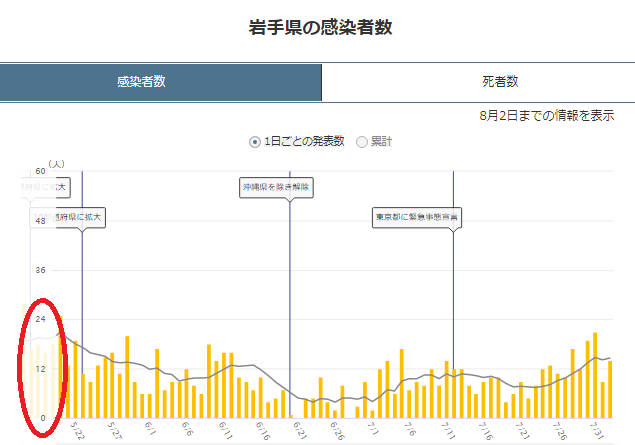
↑Is there a large or small number of infected people, about 10 to 20 people a day?
And overseas!
.. is just a review of the infection situation …!
(*worldometers)
①Israel, the most vaccinated country in the world ↓
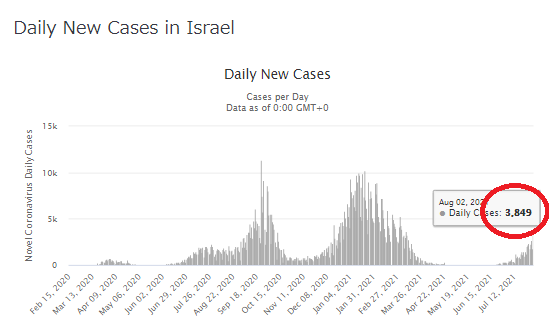

↑Even if the vaccination rate is high, the number of infected people is increasing a little …
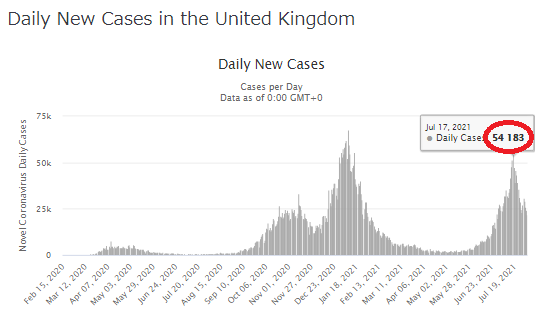
②The United Kingdom, where is in “No Guard tactics” (Although there are so many infected people, there are no restrictions on COVID-19!)
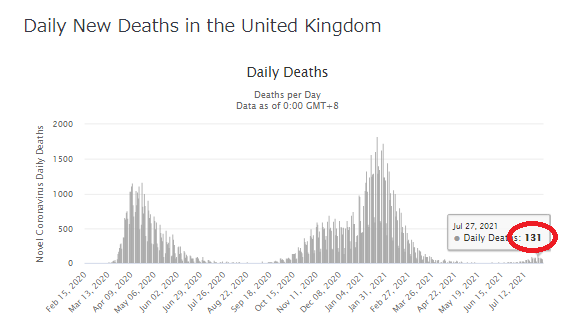
↑ The number of deaths is increasing a little …
The reason why the number of infected people is decreasing despite the no guard strategy is “unknown” …
③The United States, where achieved the “first vaccination rate of 70% for all citizens” on August 2.
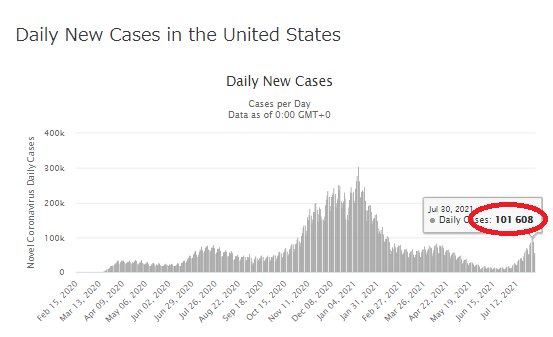
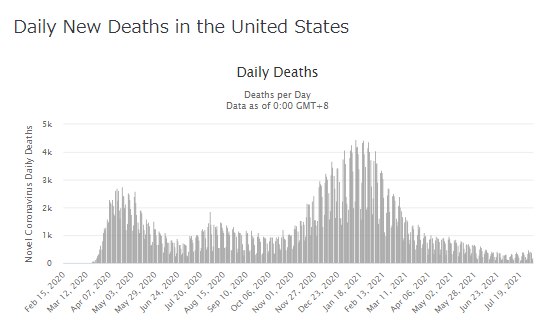
↑It seems that the number of infected people has returned to the level of July last year …
Even though vaccination is progressing quite a bit …
(*米CDC 新規感染者数“去年夏のピーク時水準に”ワクチン接種を – NHK)
The number of infected people in the United States, Israel, and the United Kingdom (although it has decreased a little) has increased this summer …!
…In Japan, where vaccination has not progressed…
And this article↓
How long time the materials such as paper, cloth, plastic, etc. need to eliminating the risk when coronavirus is attached, and how effective disinfection is.
If you are interested, please take a look!
Also, for “Does the vaccine work for mutant strains?”, See this table ↓
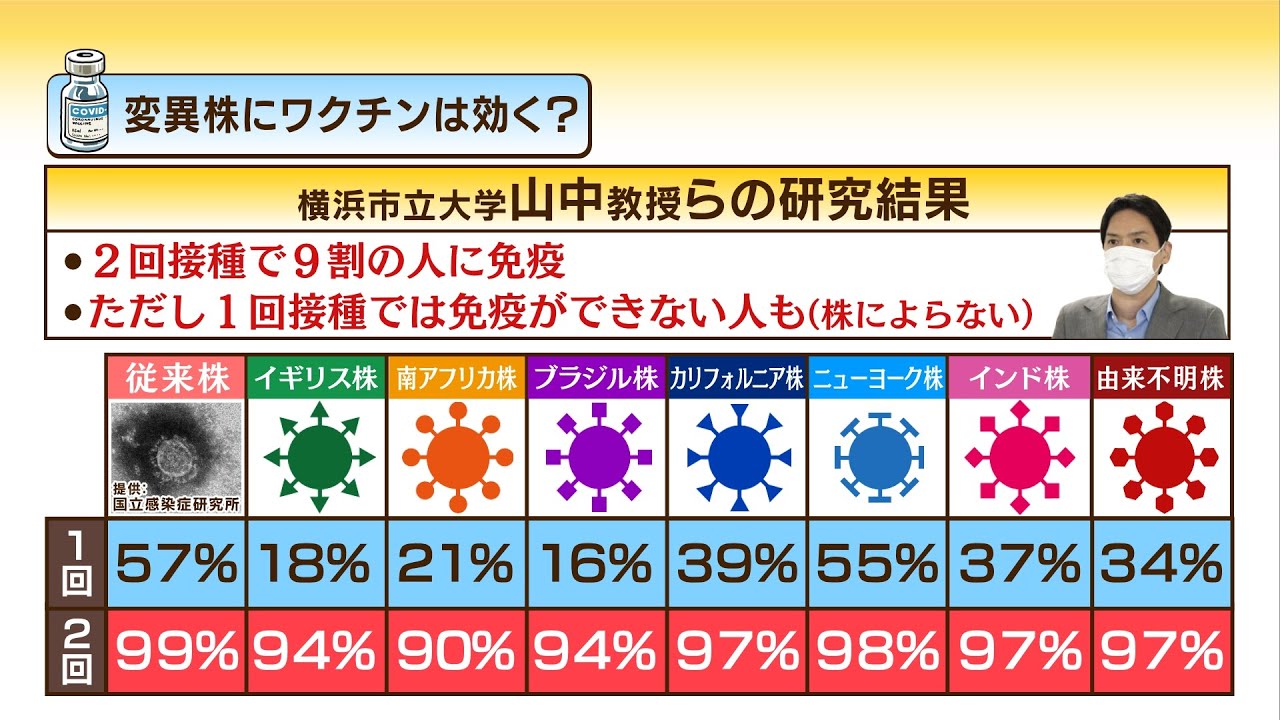
イギリス株やインド株にもワクチンは“90%以上有効” – Youtube(MBS news)
ファイザー製ワクチン ブラジル株に効果期待 東大らのグループ – NHK
↓
| Is the vaccine effective against mutant strains? (*unit : %) | ||||||||
| Number of vaccinations | Conventional | British | South african | Brazilian | California | NY | Indian | Unknown |
| Once | 57 | 18 | 21 | 16 | 39 | 55 | 37 | 34 |
| Twice | 99 | 94 | 90 | 94 | 97 | 98 | 97 | 97 |
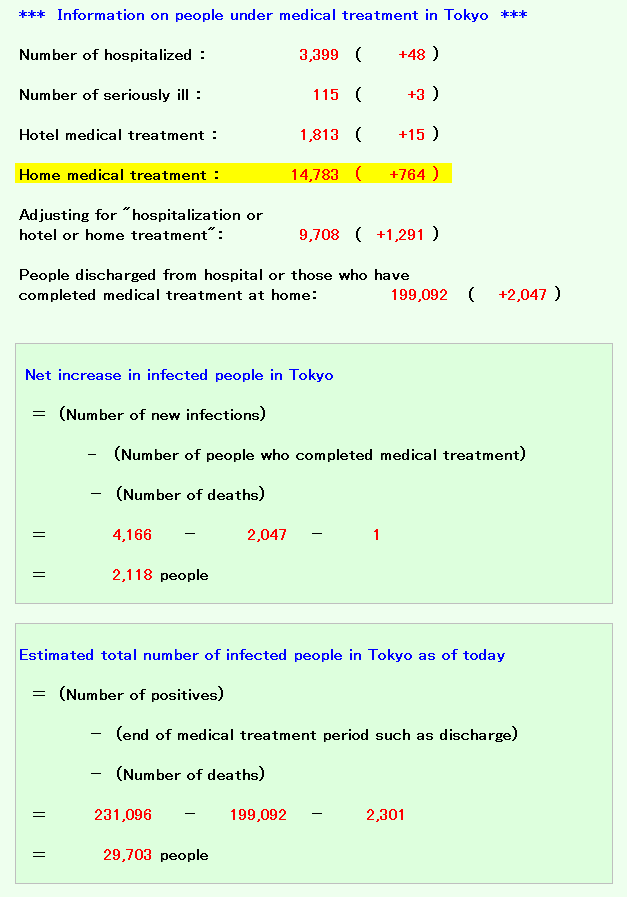
And here’s a trial calculation of how many people in Japan are actually receiving medical treatment.
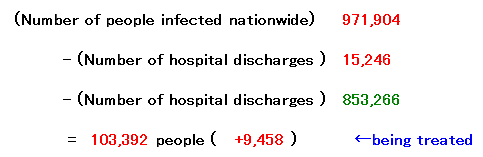
(If it is exactly as announced)
For those who are undergoing medical treatment nationwide are…
these days it’s been declining significantly on most days, but…
It seems that the infection is spreading both domestically and overseas this summer …
Not only in a specific country but also in the world … ↓
In the meantime, I’m afraid how far the infection will spread in Japan where the “consecutive holiday booster” has been applied …
If the government takes proper measures, it’s still …
I really think that.
…However, the current situation cannot be expected from the government …!
Please be careful when you go out!
AcertainFox512
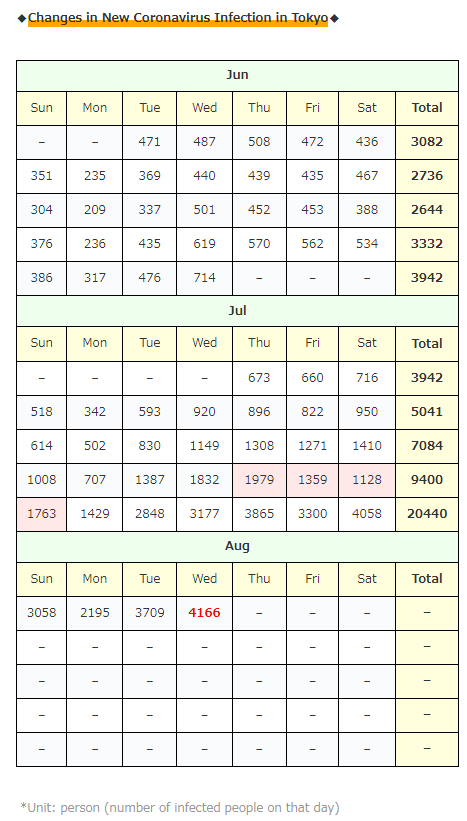
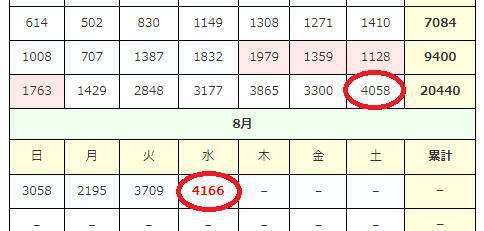
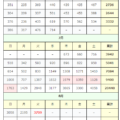
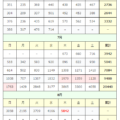
◆Changes in New Coronavirus Infection in Tokyo◆
| Jun | |||||||
| Sun | Mon | Tue | Wed | Thu | Fri | Sat | Total |
| – | – | 471 | 487 | 508 | 472 | 436 | 3082 |
| 351 | 235 | 369 | 440 | 439 | 435 | 467 | 2736 |
| 304 | 209 | 337 | 501 | 452 | 453 | 388 | 2644 |
| 376 | 236 | 435 | 619 | 570 | 562 | 534 | 3332 |
| 386 | 317 | 476 | 714 | – | – | – | 3942 |
| Jul | |||||||
| Sun | Mon | Tue | Wed | Thu | Fri | Sat | Total |
| – | – | – | – | 673 | 660 | 716 | 3942 |
| 518 | 342 | 593 | 920 | 896 | 822 | 950 | 5041 |
| 614 | 502 | 830 | 1149 | 1308 | 1271 | 1410 | 7084 |
| 1008 | 707 | 1387 | 1832 | 1979 | 1359 | 1128 | 9400 |
| 1763 | 1429 | 2848 | 3177 | 3865 | 3300 | 4058 | 20440 |
| Aug | |||||||
| Sun | Mon | Tue | Wed | Thu | Fri | Sat | Total |
| 3058 | 2195 | 3709 | 4166 | – | – | – | – |
| – | – | – | – | – | – | – | – |
| – | – | – | – | – | – | – | – |
| – | – | – | – | – | – | – | – |
| – | – | – | – | – | – | – | – |
*Unit: person (number of infected people on that day)
コメント