*** This article is written with the help of Google Translate… ***
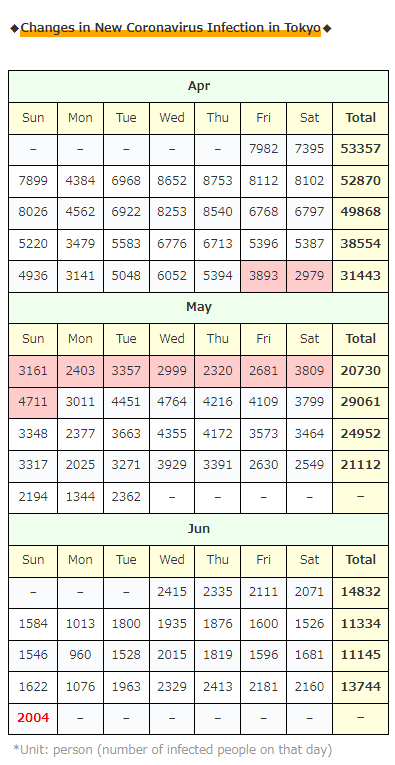
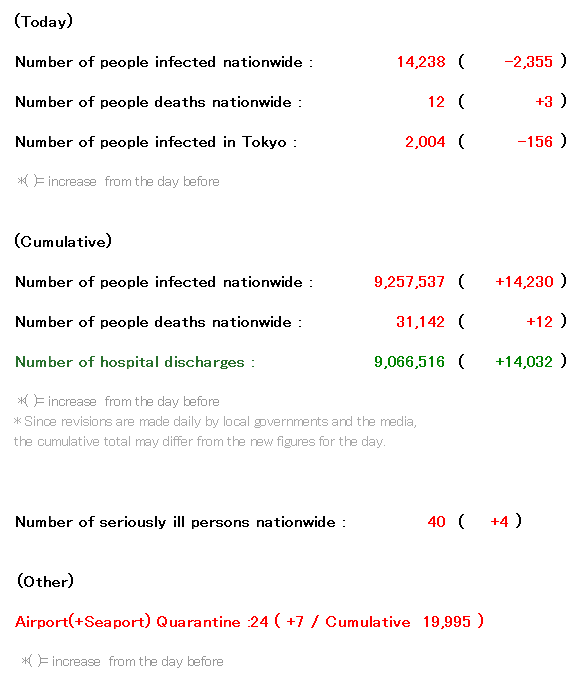
2,004 (-156 from the day before) new infections confirmed in Tokyo.
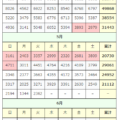
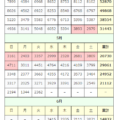
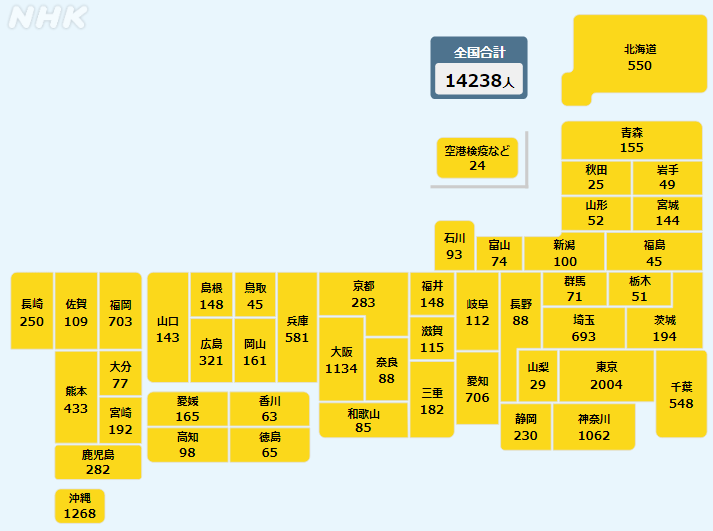
◆◆◆ Japan ◆◆◆
(Cumulative) * The following is up to 10 worst prefectures.
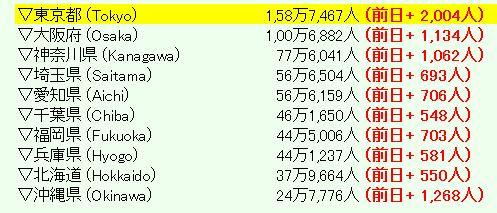
*( )= increase from the day before
(*All of the above from NHK NEWS WEB)
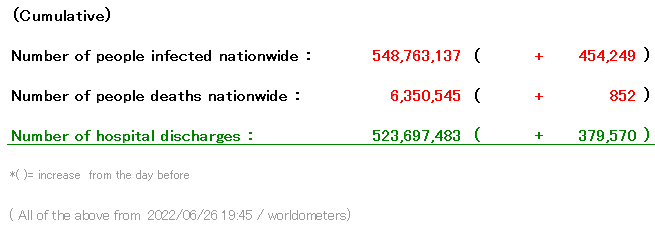
◆◆◆ World ◆◆◆
The number of infected people in Tokyo is ..
Hmm …
This week also started with “increasing from the previous week” …
Today I summarized it in the topic section of ↓, but…
it seems that the increase will start from here ………………
Meanwhile… How about the amount of people in the city in Tokyo…↓
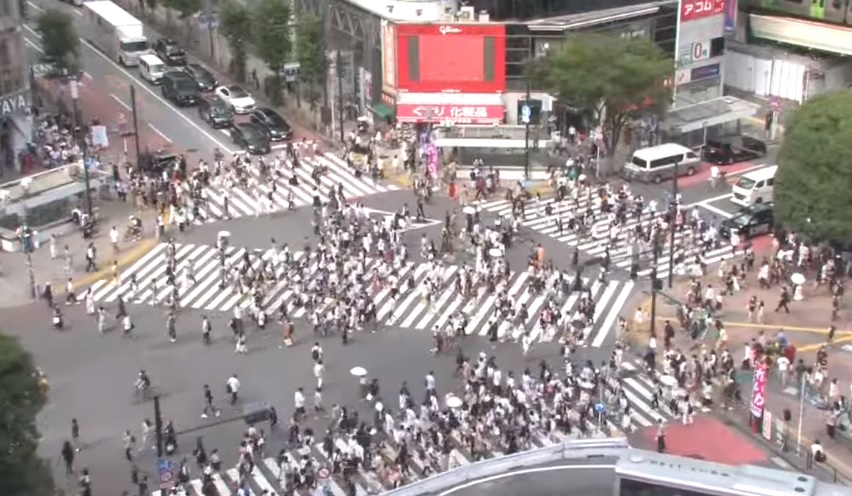
(Around 15:00 today, Shibuya Scramble Crossing, Tokyo)
Well, I will summarize
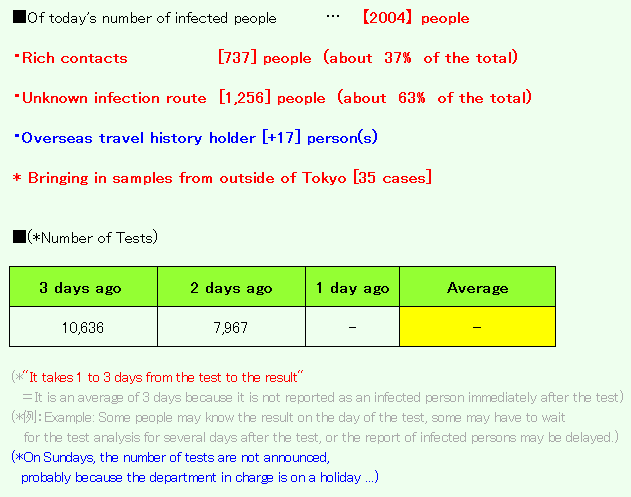
the breakdown of the number of new infections in Tokyo + α …!
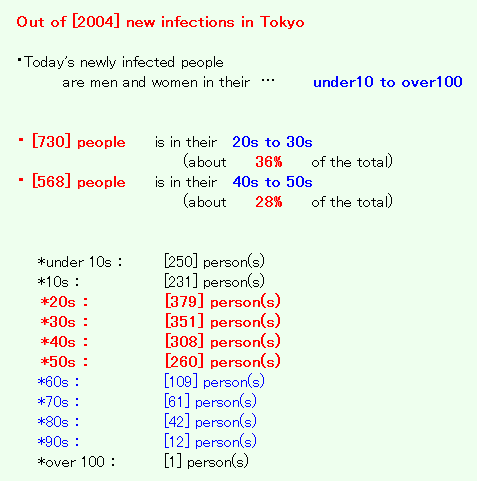
(Individual infection information)
・Of the【2,004】 people today, 【1062】 people (53%) seem to have completed both vaccinations …
・ The positive rate in the test in Tokyo seems to be 【10.6%】 as of Jun 10
(As of April 27, 2022)
※*Tokyo currently has 33 facilities for infected people(February 22-)
(Capacity for a total of 8,850 beds)
(*Since space for staff and storage space for materials are also required, the number that can be accommodated is smaller than the number secured)
* A hospital in Tokyo has secured 6,560 beds
(6,319 for mild cases + 421 for severe cases)
*The hotels are that,
the b Ikebukuro
Day Nice Hotel Tokyo
Toyoko Inn Shinjuku Kabukicho
Toyoko Inn Tokyo Station Shin-Ohashi-mae
East Tower (Shinagawa Prince Hotel)
Toyoko Inn Fuchu Nanbu Line Minamitama Station
APA Hotel & Resort Nishi-Shinjuku 5-chome Station Tower
APA Hotel Yamanote Otsuka Station Tower (Return from temporary suspension)
Toyoko Inn Ikebukuro North Exit II
APA Hotel Shinagawa Izumidakeji Ekimae (Return from temporary suspension)
In front of APA Hotel Pride Parliament Building
APA Hotel Higashi Shinjuku Kabukicho Tower
Tokyu Stay Takanawa
APA Hotel Shinjuku Gyoenmae
Comfort Hotel Tokyo Higashi Nihonbashi
APA Hotel TKP Nippori Ekimae
Far East Village Hotel Tokyo Ariake
Hotel Gracery Shinjuku
Tokyo Bay Ariake Washington Hotel
Toyoko Inn Haneda Airport 2
Candeo Hotels Ueno Park
R & B Hotel Kamata East Exit
APA Hotel Omori Station
Comfort Hotel Tokyo Higashi Kanda
KOKO HOTEL Ginza 1-chome
the b akasaka
R & B Hotel Ueno Hirokoji
R & B Hotel Tokyo Toyocho
APA Hotel Ueno Hirokoji
Shinjuku Washington Hotel New Building
THE KNOT TOKYO Shinjuku
APA Hotel Shinjuku Kabukicho Tower
Tokyo Pet-accompanied accommodation medical treatment facility
(Discontinued facility)
APA Hotel Asakusa Taharamachi Ekimae * Ended March 31, 3rd year of Reiwa
Tokyo Toranomon Tokyu REI * Ended March 31, 3rd year of Reiwa
Hachioji Sky Hotel * Ended October 31, 3rd year of Reiwa
Kichijoji Tokyu REI * Ended January 15, 4th year of Reiwa
※ 東京都福祉保健局 ※1施設追加|東京都 ※宿泊療養について(施設名一覧あり)
※ 東京で宿泊療養3千人止まり 即時対応難しく – Yahoo!
※新型コロナウイルス感染症の療養者の状況 – 東京都福祉保健局
※感染者総数試算のソースは東京都の『新型コロナウイルス感染症対策サイト』より
・Quarantine at the airport passengers arriving at the airport from overseas.
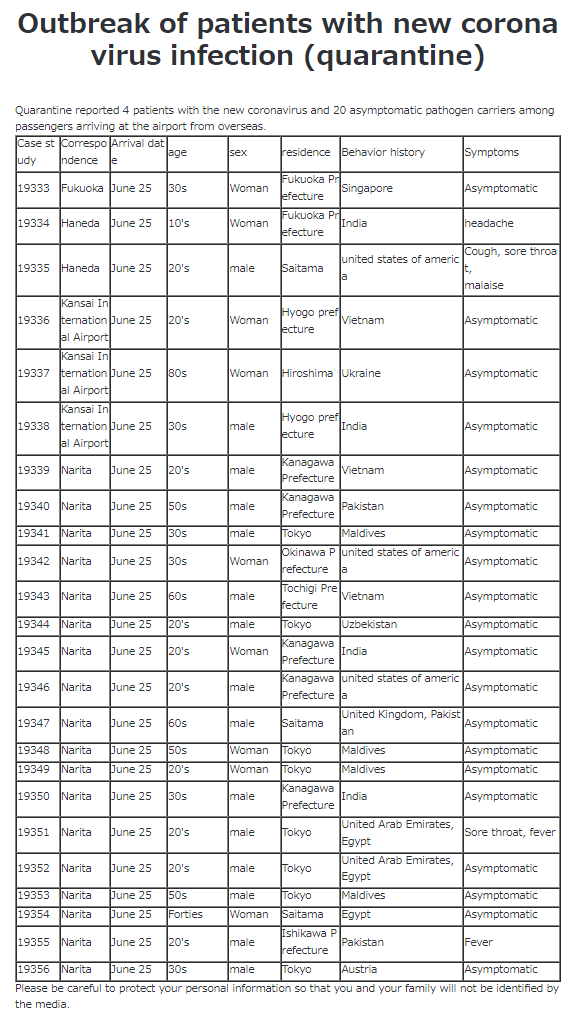
↓ ↓ ↓
(↑Please click the image to continue)
From the website of the Ministry of Health, Labor and Welfare
Click here for detailed information on current border measures and isolation period ↓
(*海外安全ホームページ – 外務省)
*Since the number of new infections in Tokyo seems to be almost the number of the previous day,
(Because the deadline for the number of new infections on the day is from 9:00 am the day before to 9:00 am on the day)
And also today, I will summarize some prefectures that have a high number of infected people, not just in the Tokyo area.
*** Saitama ***
・New infections are [693] people (*Max of up to yesterday=7354)
(Individual infection information)
・It seems that clusters have been confirmed in a total of [?] locations …
*** Kanagawa ***
・New infections are [1062] people (*Max of up to yesterday=9097)
(Individual infection information)
・It seems that clusters have been confirmed in a total of [2] locations …
*** Chiba ***
・New infections are [548] people (*Max of up to yesterday=6604)
(Individual infection information)
・It seems that new clusters have been confirmed in a total of [2] locations …
*The following areas introduced until the other day will be excluded for a while.
①About “Osaka / Aichi / Okinawa / Hyogo / Kyoto”
→I have summarized this for the past year, but the details of the infection rarely appear during the day.
②About “Hokkaido”
→Infection is settling down
* In addition, the number of infected people in each prefecture at the present time (19:00) seems to be like this! ↓
*Graph of the number of newly infected people in Japan as of yesterday
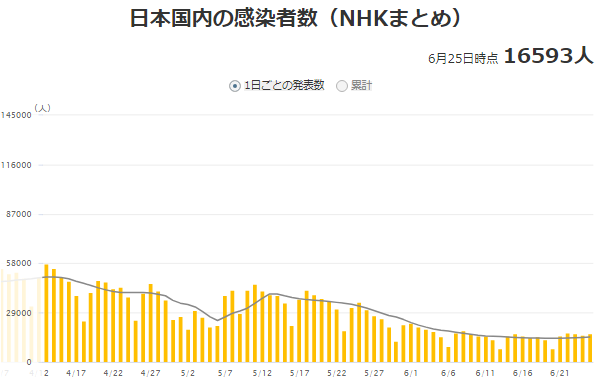
(*NHK NEWS WEB)
<Summary of today’s “Major News Related to COVID-19 in Japan”>
By the way, yesterday, the line for the week was completed last week …
![]()
But in the end, the total for the week was the first increase in a month and a half …
There is a clear reason for the last two times.
The reason for the increase from “end of March” to “first week of April” was
“spring holiday season + cherry blossom viewing season + transfer season”
The increase in “2nd week of May” was
“the next week after GW, so it was the influence of GW”
This is what happened, but…
what is the reason for the increase in the total for one week from the previous week …?
By the way, the situation at this time of the past two years is like this … ↓
(2020 – COVID-19 disaster first year)
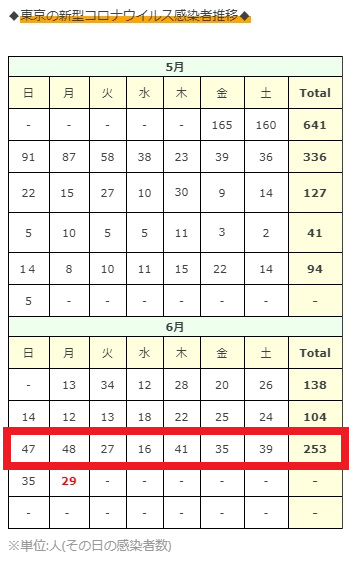
(*May-Jun)
(2021 – last year)
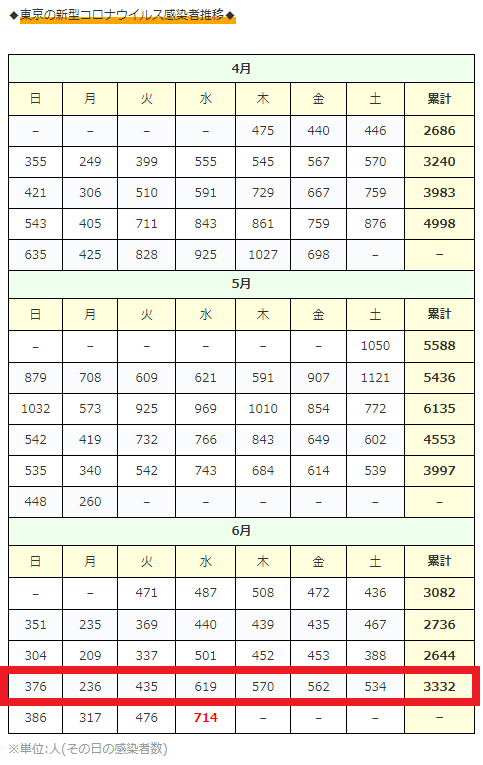
(*Apr-Jun)
Oh …
The scale is different, but it’s increasing every year just this week … (dry laugh)
From the end of May to the beginning of June, when the number of infected people has decreased significantly after the influence of Golden Week, the government did extra deregulation without thinking about anything, so it seems that the effect start to appear this week every year. … (Dry laugh)
そAnyway, I think it’s too much to “bottom out” with a large number of 1000 to 2000 people …
By the way, it became like this after last year ↓
↑After all, the increase started from this week, and
after a slight increase for only one week and then a sharp increase for several weeks,
the infection exploded at once from the consecutive holidays in the latter half of July.
… And after the influence of the end of “Obon Holidays(Aug 13 – Aug 16)” has diminished, it has begun to decrease.
as a side note…
(Summary article on June 26, 2020 – Tokyo! Japan! Life Now!)
(sorry it’s the article only in japanese…)
(Summary article on June 26, 2021 last year – Tokyo! Japan! Life Now!)
(This is the article in English)
↑ Nostalgic (lol)
Considering that, this increase seems to be the same as every year … (dry laugh)
Hmmm……………
The government seems to repeat the same thing without learning anything even if it experiences the same thing for tens of thousands of years …
↓ In addition, there was such an article! ↓
And this article↓
How long time the materials such as paper, cloth, plastic, etc. need to eliminating the risk when coronavirus is attached, and how effective disinfection is.
If you are interested, please take a look!
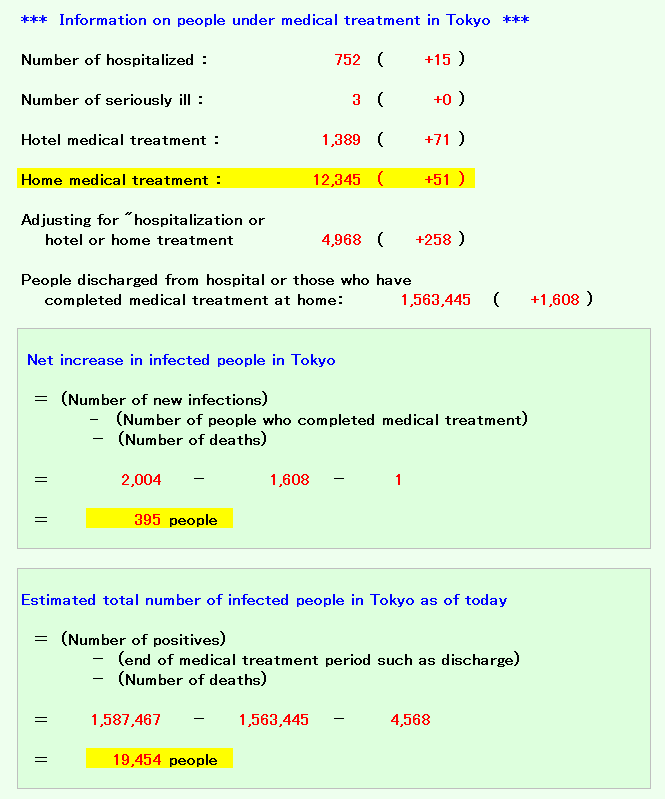
And here’s a trial calculation of how many people in Japan are actually receiving medical treatment.
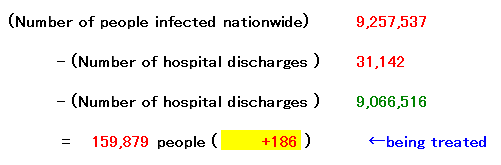
(If it is exactly as announced)
For those who are undergoing medical treatment nationwide are…
The number of newly infected people in Japan is so terrible that the situation is no longer understandable, but there are still so many patients.
By the way, this increase is not only 1 metropolitan area and 3 prefectures!
I introduced it yesterday, but … ↓
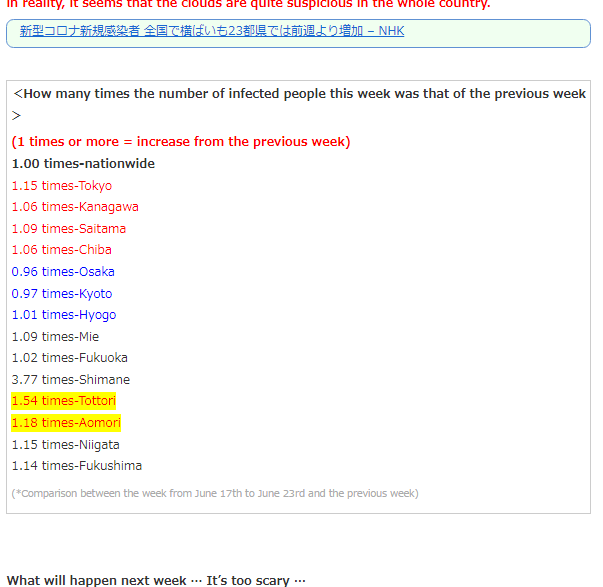
↑ It seems to be increasing nationwide …
I have a bad feeling that the increase in Tottori and Shimane, which has the lowest cumulative number of infected people in Japan, is the largest.
It’s still good if COVID-19 is “only in winter!” like influenza, but it’s all year round …
Hmm … what will happen this summer …………: (
Please be careful when you go out!
AcertainFox512
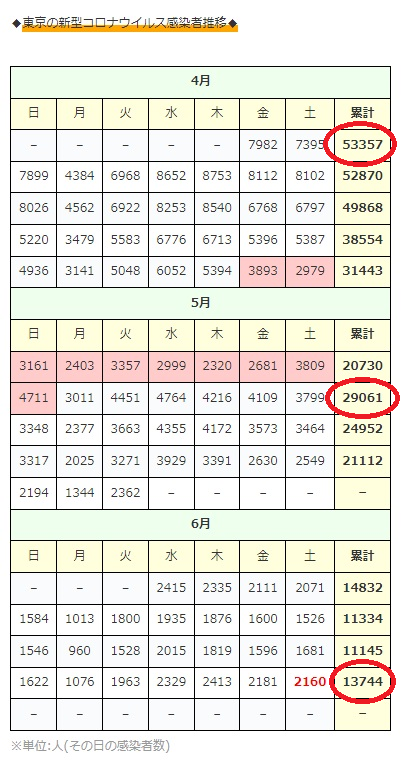
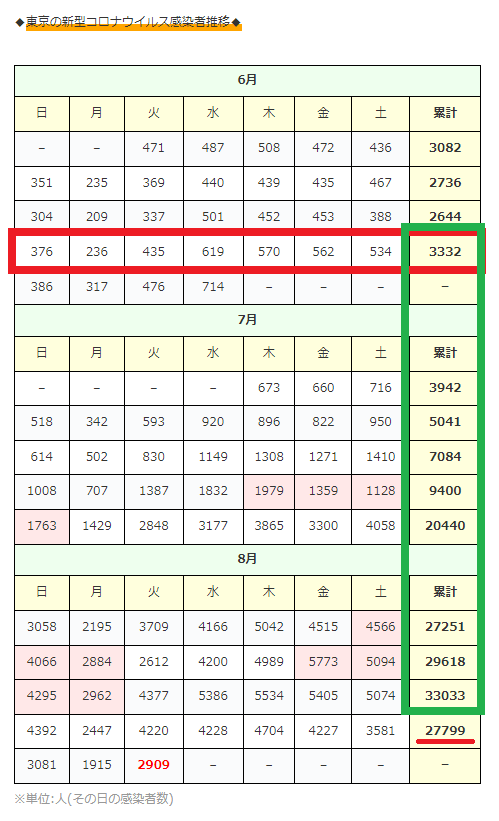
◆Changes in New Coronavirus Infection in Tokyo◆
| Apr | |||||||
| Sun | Mon | Tue | Wed | Thu | Fri | Sat | Total |
| – | – | – | – | – | 7982 | 7395 | 53357 |
| 7899 | 4384 | 6968 | 8652 | 8753 | 8112 | 8102 | 52870 |
| 8026 | 4562 | 6922 | 8253 | 8540 | 6768 | 6797 | 49868 |
| 5220 | 3479 | 5583 | 6776 | 6713 | 5396 | 5387 | 38554 |
| 4936 | 3141 | 5048 | 6052 | 5394 | 3893 | 2979 | 31443 |
| May | |||||||
| Sun | Mon | Tue | Wed | Thu | Fri | Sat | Total |
| 3161 | 2403 | 3357 | 2999 | 2320 | 2681 | 3809 | 20730 |
| 4711 | 3011 | 4451 | 4764 | 4216 | 4109 | 3799 | 29061 |
| 3348 | 2377 | 3663 | 4355 | 4172 | 3573 | 3464 | 24952 |
| 3317 | 2025 | 3271 | 3929 | 3391 | 2630 | 2549 | 21112 |
| 2194 | 1344 | 2362 | – | – | – | – | – |
| Jun | |||||||
| Sun | Mon | Tue | Wed | Thu | Fri | Sat | Total |
| – | – | – | 2415 | 2335 | 2111 | 2071 | 14832 |
| 1584 | 1013 | 1800 | 1935 | 1876 | 1600 | 1526 | 11334 |
| 1546 | 960 | 1528 | 2015 | 1819 | 1596 | 1681 | 11145 |
| 1622 | 1076 | 1963 | 2329 | 2413 | 2181 | 2160 | 13744 |
| 2004 | – | – | – | – | – | – | – |
*Unit: person (number of infected people on that day)