*** This article is written with the help of Google Translate… ***
9,520 (+1,674 from the day before) new infections confirmed in Tokyo.
◆◆◆ Japan ◆◆◆
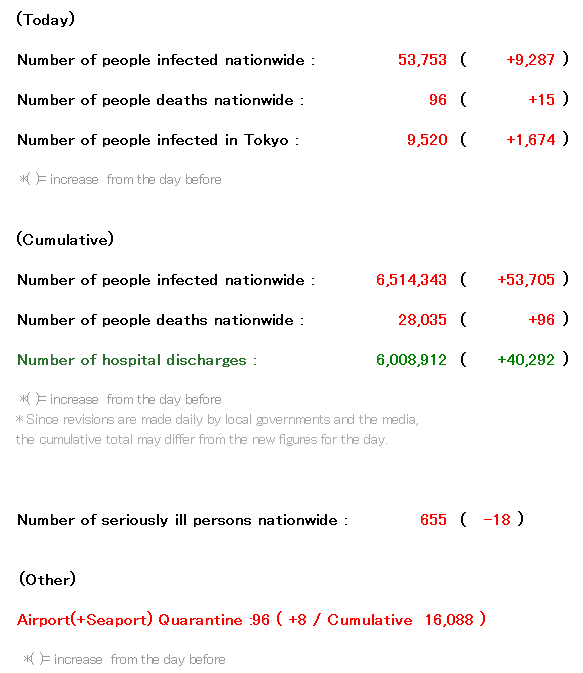
(Cumulative) * The following is up to 10 worst prefectures.
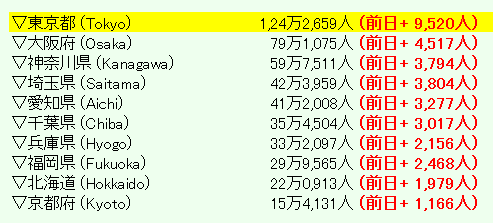
*( )= increase from the day before
(*All of the above from NHK NEWS WEB)
◆◆◆ World ◆◆◆
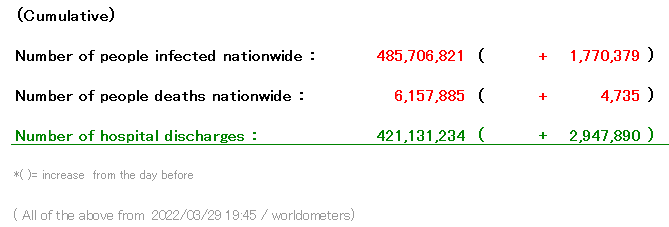
The number of infected people in Tokyo is …compared to last week …no,
before that, it seems that the number will exceed 10,000 again ……………
This … is completely re-expanding …?
As expected, only dry laughter comes out …!
Meanwhile… How about the amount of people in the city in Tokyo…↓

(Around 15:00 today, Shibuya Scramble Crossing, Tokyo)
Well, I will summarize
the breakdown of the number of new infections in Tokyo + α …!
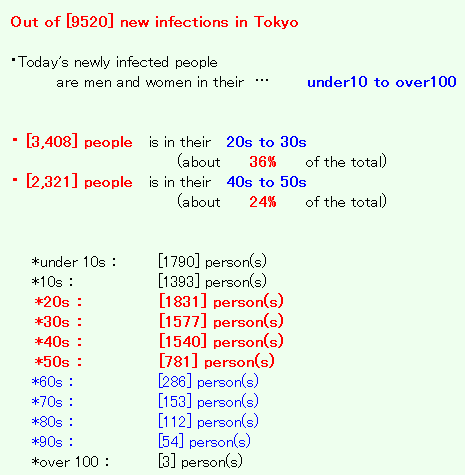
・ [N/A] people is
in 『the entertainment district at night』
→Employees and guests such as host clubs and cabaret clubs
・Infection at home [-] people
・Infection at office [-] people
・Infection in the facility [-] people
・Infection by eating out [-] people
・Infection via other routes [-] people
(Individual infection information)
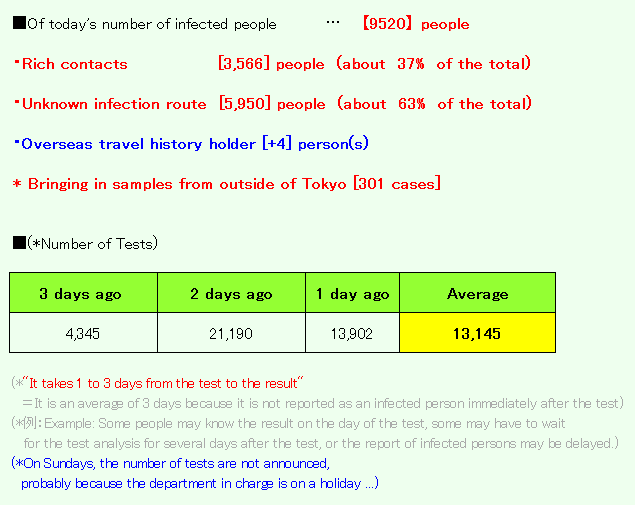
・Of the【9,520】 people today, 【4476】 people (47%) seem to have completed both vaccinations …
・ The positive rate in the test in Tokyo seems to be 【34.4%】 as of Mar 04

(Red letters are as of January 27, 2022)
*Tokyo currently has 16 facilities for infected people→19 facilities
(Capacity of 6,240 people)→7976 rooms (5420 people)
(*Since space for staff and storage space for materials are also required, the number that can be accommodated is smaller than the number secured)
* A hospital in Tokyo has secured 5967 beds (+392 beds→510 beds for critically ill patients).→6919 beds
→ According to national standards, the number of beds for severe cases was 1207. (*Yahoo!)→1468 beds
*The hotels are that,
the b Ikebukuro
Toyoko Inn Shinjuku Kabukicho
Toyoko Inn Tokyo Station Shin-Ohashi-mae
East Tower (Shinagawa Prince Hotel)
Toyoko Inn Fuchu Nanbu Line Minamitama Station
APA Hotel & Resort Nishi-Shinjuku 5-chome Station Tower
Toyoko Inn Ikebukuro North Exit II
In front of APA Hotel Pride Parliament Building
APA Hotel Higashi Shinjuku Kabukicho Tower
Tokyu Stay Takanawa
APA Hotel Shinjuku Gyoenmae
Comfort Hotel Tokyo Higashi Nihonbashi
APA Hotel TKP Nippori Ekimae
Far East Village Hotel Tokyo Ariake
Hotel Gracery Shinjuku
Tokyo Bay Ariake Washington Hotel
Toyoko Inn Haneda Airport 2
Candeo Hotels Ueno Park
Tokyo Pet-accompanied accommodation medical treatment facility
(Discontinued facility)
Day Nice Hotel Tokyo * Ended May 31, 3rd year of Reiwa
APA Hotel Asakusa Taharamachi Ekimae * Ended March 31, 3rd year of Reiwa
Tokyo Toranomon Tokyu REI * Ended March 31, 3rd year of Reiwa
Toyoko Inn Fuchu Nanbu Line Minamitama Station * Ended April 16, 3rd year of Reiwa
APA Hotel Yamanote Otsuka Station Tower * Temporarily suspended
APA Hotel Shinagawa Izumidakeji Ekimae * Temporarily suspended
Hachioji Sky Hotel * Ended October 31, 3rd year of Reiwa
Kichijoji Tokyu REI * Ended January 15, 4th year of Reiwa
※ 東京都福祉保健局 ※1施設追加|東京都 ※宿泊療養について(施設名一覧あり)
※ 東京で宿泊療養3千人止まり 即時対応難しく – Yahoo!
※感染者総数試算のソースは東京都の『新型コロナウイルス感染症対策サイト』より
・Quarantine at the airport passengers arriving at the airport from overseas.

↓ ↓ ↓
(↑Please click the image to continue)
From the website of the Ministry of Health, Labor and Welfare
Click here for detailed information on current border measures and isolation period ↓
(*海外安全ホームページ – 外務省)
*Since the number of new infections in Tokyo seems to be almost the number of the previous day,
(Because the deadline for the number of new infections on the day is from 9:00 am the day before to 9:00 am on the day)
And also today, I will summarize some prefectures that have a high number of infected people, not just in the Tokyo area.
*** Saitama ***
・New infections are [3804] people (*Max of up to yesterday=7354)
(Individual infection information)
・It seems that clusters have been confirmed in a total of [?] locations …
*** Kanagawa ***
・New infections are [3794] people (*Max of up to yesterday=9097)
(Individual infection information)
・It seems that clusters have been confirmed in a total of [12] locations …
*** Chiba ***
・New infections are [3017] people (*Max of up to yesterday=6604)
(Individual infection information)
・It seems that new clusters have been confirmed in a total of [?] locations …
*The following areas introduced until the other day will be excluded for a while.
①About “Osaka / Aichi / Okinawa / Hyogo / Kyoto”
→I have summarized this for the past year, but the details of the infection rarely appear during the day.
②About “Hokkaido”
→Infection is settling down
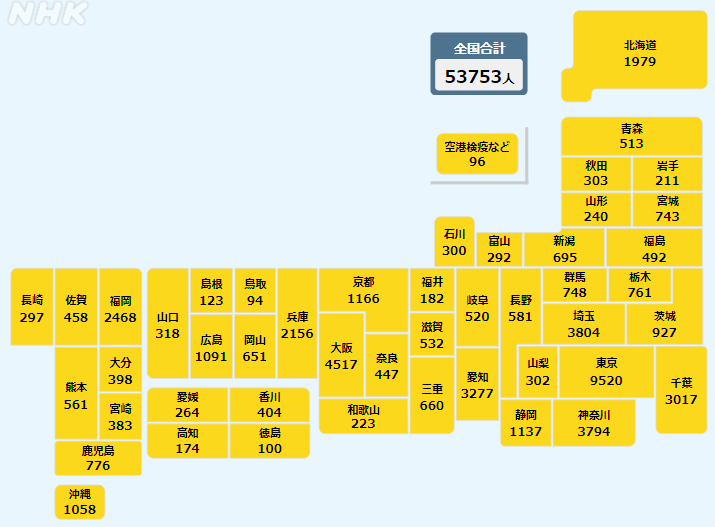
* In addition, the number of infected people in each prefecture at the present time (19:00) seems to be like this! ↓
*Graph of the number of newly infected people in Japan as of yesterday
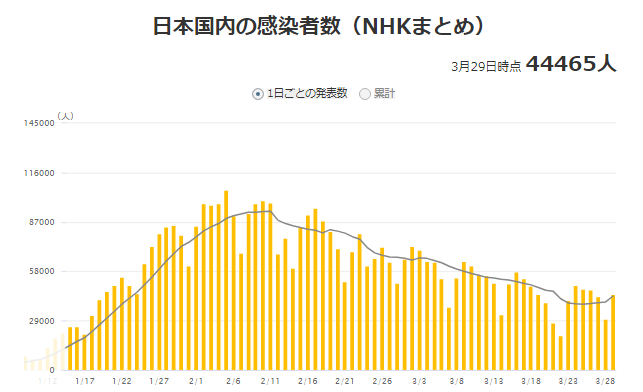
(*NHK NEWS WEB)
<Summary of today’s “Major News Related to COVID-19 in Japan”>
I will introduce from this article today!
According to the research group of Yokohama City University Hospital, the number of suicides under the COVID-19 disaster was higher than when COVID-19 did not exist …
(*Number of suicides expected from the past 11 years VS Actual Number of suicides)
The data actually released seems to be below compared to the expected number.
31% increase for women,
17% increase for men,
72% increase especially for women in their 20s
By the way, in the article, it was concluded that “it affected the younger generation because of financial hardship” … Is that really the case?
I think it’s more likely that people are more likely to lose their mental balance because the relationship between people has diminished, but it’s like that around me. What do you think about this??
By the way, the topic changed, and NHK provided such data!
In this “summary article”, I often introduce the daily infection rate by age group in Tokyo as a graph, but NHK provided the monthly infection rate by age group in Tokyo!
According to it ↓
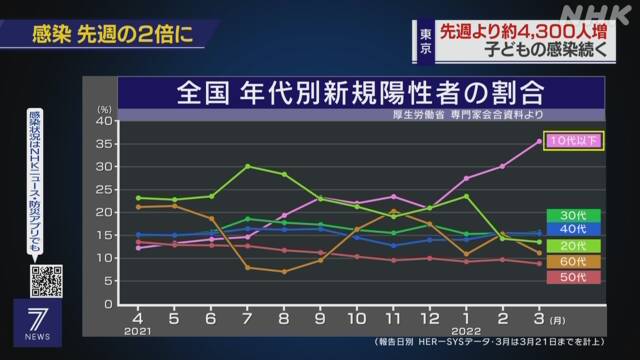
↑If you look at it monthly like this, you can see more about the infection status!
According to that, the following can be understood well.
・ The figures for people in their twenties, who had been the main players in the infection for a year and a half until the fifth wave, have settled down to an average level.
・ Numbers for teens and younger have skyrocketed since around July last year.
・ Other than that, only the numbers in their 60s (orange) have a mysterious fluctuation.
The numbers for teens and younger include exactly two generations, under 10 and teens, so I’m not sure if the volume is high relative to the population, but it is worrisome that the number of infected people of that generation, which was still much smaller, has suddenly increased since July last year.
Since July last year = from the 5th wave, so…it means that the variants after Delta Variant have evolved to be able to infect generations that have not been supported until now …
(Because I remember that there was no major policy change at that time …)
Even if you see that the number of people in their twenties, who had a large number of infected people until the fifth wave, has settled down to the average level, the virus seems to has evolved wisely so that it can be easily transmitted to anyone regardless of their behavior…
That information confirms that, doesn’t it?
If not … “The generation over 30s started ignoring COVID-19 completely like their 20s, and started to act freely and became more susceptible to infection.” Is that so?
↓ In addition, there was such an article! ↓
And this article↓
How long time the materials such as paper, cloth, plastic, etc. need to eliminating the risk when coronavirus is attached, and how effective disinfection is.
If you are interested, please take a look!
And here’s a trial calculation of how many people in Japan are actually receiving medical treatment.

(If it is exactly as announced)
For those who are undergoing medical treatment nationwide are…
It’s increasing every day, but there are days when it’s decreasing …!
There were consecutive holidays last week, so it’s not very helpful, but
according to each news site, “the number of infected people has started to increase in more areas” …!
<前の週との比較/3月21日~3月28日の感染者数>
▼ Tochigi prefecture ― 1.03 times
▼ Gifu prefecture ― 1.07 times
▼ Akita prefecture ― 1.07 times
▼ Tottori prefecture ― 1.15 times
▼ Hiroshima prefecture ― 1.06 times
▼ Saga prefecture ― 1.13 times
▼ Oita prefecture ― 1.20 times
▼ Kagoshima prefecture ― 1.33 times
▼ Okinawa Prefecture ― 1.14 times
(* 1 times or more = more than last week)
But … For example, Tokyo ↓
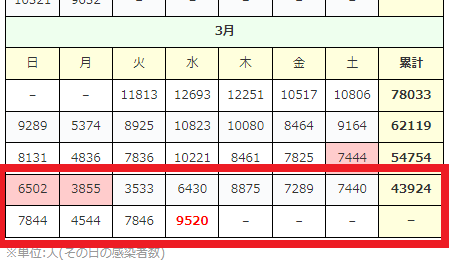
↑As you can see, last week and this week are volatile due to the consecutive holidays (red background part of the calendar), so it may not be very helpful until this settles down …!
I hope the infection doesn’t spread …!
Please be careful when you go out!
AcertainFox512
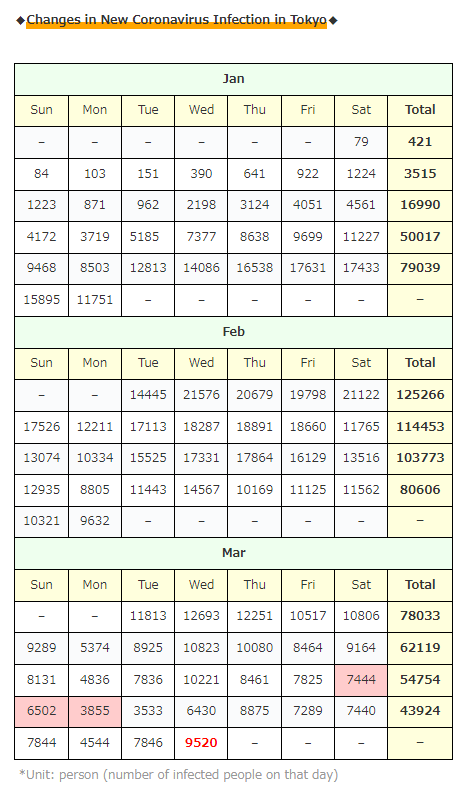
◆Changes in New Coronavirus Infection in Tokyo◆
| Jan | |||||||
| Sun | Mon | Tue | Wed | Thu | Fri | Sat | Total |
| – | – | – | – | – | – | 79 | 421 |
| 84 | 103 | 151 | 390 | 641 | 922 | 1224 | 3515 |
| 1223 | 871 | 962 | 2198 | 3124 | 4051 | 4561 | 16990 |
| 4172 | 3719 | 5185 | 7377 | 8638 | 9699 | 11227 | 50017 |
| 9468 | 8503 | 12813 | 14086 | 16538 | 17631 | 17433 | 79039 |
| 15895 | 11751 | – | – | – | – | – | – |
| Feb | |||||||
| Sun | Mon | Tue | Wed | Thu | Fri | Sat | Total |
| – | – | 14445 | 21576 | 20679 | 19798 | 21122 | 125266 |
| 17526 | 12211 | 17113 | 18287 | 18891 | 18660 | 11765 | 114453 |
| 13074 | 10334 | 15525 | 17331 | 17864 | 16129 | 13516 | 103773 |
| 12935 | 8805 | 11443 | 14567 | 10169 | 11125 | 11562 | 80606 |
| 10321 | 9632 | – | – | – | – | – | – |
| Mar | |||||||
| Sun | Mon | Tue | Wed | Thu | Fri | Sat | Total |
| – | – | 11813 | 12693 | 12251 | 10517 | 10806 | 78033 |
| 9289 | 5374 | 8925 | 10823 | 10080 | 8464 | 9164 | 62119 |
| 8131 | 4836 | 7836 | 10221 | 8461 | 7825 | 7444 | 54754 |
| 6502 | 3855 | 3533 | 6430 | 8875 | 7289 | 7440 | 43924 |
| 7844 | 4544 | 7846 | 9520 | – | – | – | – |
*Unit: person (number of infected people on that day)

