
*** This article is written with the help of Google Translate… ***
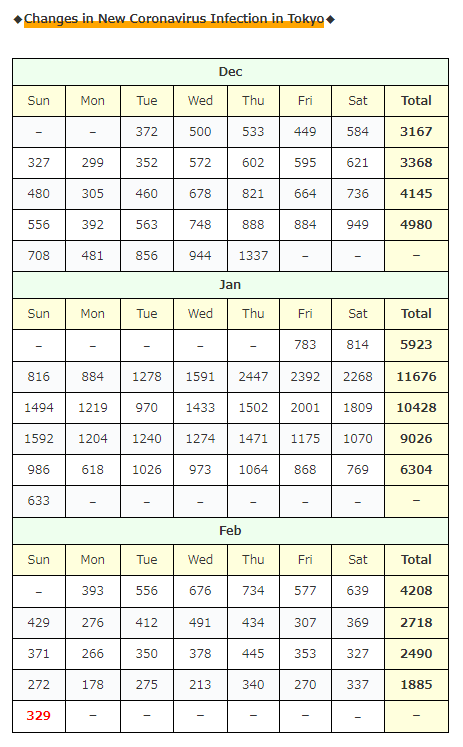
329 ( -8 from the day before) new infections confirmed in Tokyo.
◆◆◆ Japan ◆◆◆
(Today)
Number of people infected nationwide : 999 ( -215)
Number of people deaths nationwide : 30 ( -11)
Number of people infected in Tokyo : 329 ( -8)
*( )= increase from the day before
(Cumulative)
Number of people infected nationwide : 433,432 ( +998)
Number of people deaths nationwide : 7,910 ( +30)
Number of hospital discharges : 409,978 ( +1,299)
*( )= increase from the day before
* Since revisions are made daily by local governments and the media,
the cumulative total may differ from the new figures for the day.
Number of seriously ill persons nationwide : 434 ( -6)
(Other)
Narita Airport Quarantine : 5 ( -1 / Total 2,386)
*( )= increase from the day before
(Cumulative) * The following is up to 10 worst prefectures.
▽東京都 (Tokyo) 111,676人 (前日+ 329人)
▽大阪府 (Osaka) 47,069人(前日+ 54人)
▽神奈川県 (Kanagawa) 44,767人 (前日+ 131人)
▽埼玉県 (Saitama) 29,344人 (前日+ 97人)
▽千葉県 (Chiba) 26,380人 (前日+132人)
▽愛知県 (Aichi) 26,890人 (前日+ 31人)
▽北海道 (Hokkaido) 19,093人 (前日+ 27人)
▽福岡県 (Fukuoka) 18,061人 (前日+ 23人)
▽兵庫県 (Hyogo) 17,969人 (前日+ 26人)
▽京都府 (Kyoto) 9,064人 (前日+ 3人)
*( )= increase from the day before
(*All of the above from 2021/02/28 19:14 / NHK NEWS WEB)
◆◆◆ World ◆◆◆
(Cumulative)
Number of people infected nationwide : 114,449,072 ( +378,755)
Number of people deaths nationwide : 2,538,799 ( +7,697)
Number of hospital discharges : 89,997,147 ( +379,242)
( All of the above from 2021/02/28 19:47 / worldometers)
*( )= increase from the day before
The umber of newly infected people in Tokyo has increased from the same day of the previous week for the second consecutive day …
The percentages by age are as follows recently.
20s-30s-35-40%
40s-50s-25-30%
However, it is unusually low today, so maybe a large cluster has occurred in a facility for the elderly …
Meanwhile… How about the amount of people in the city in Tokyo…
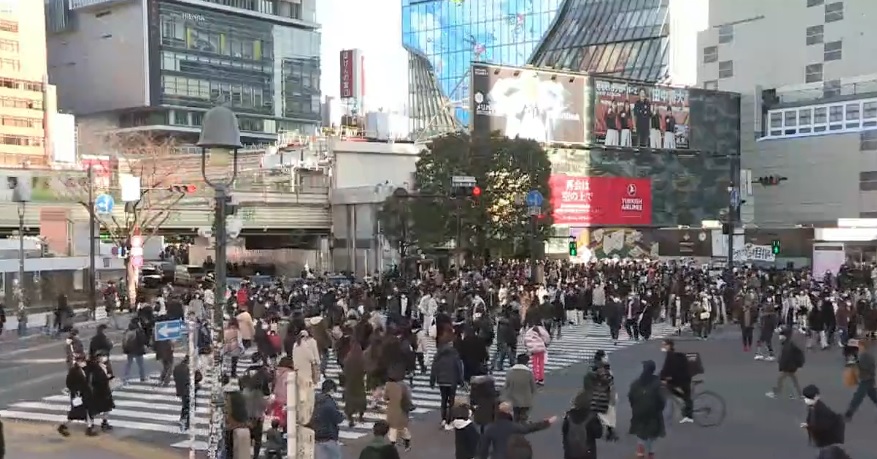
(Around 15:00 on Feb 28, Shibuya Scramble Crossing, Tokyo)
The amount of people in the city is … as usual (many) …!
Well, I will summarize
the breakdown of the number of new infections in Tokyo + α …!
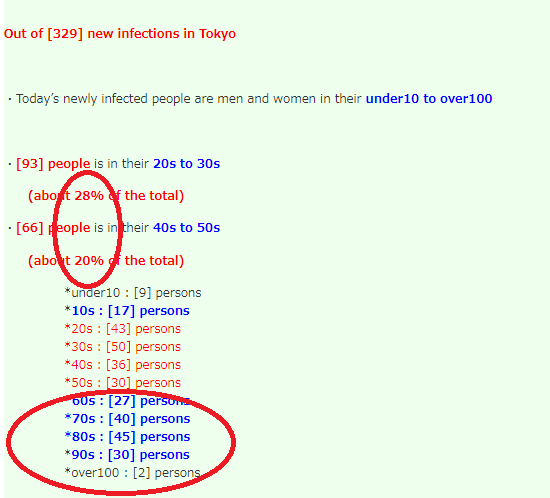
Out of [329] new infections in Tokyo
・Today’s newly infected people are men and women in their under10 to over100
・[93] people is in their 20s to 30s
(about 28% of the total)
・[66] people is in their 40s to 50s
(about 20% of the total)
*under10 : [9] persons
*10s : [17] persons
*20s : [43] persons
*30s : [50] persons
*40s : [36] persons
*50s : [30] persons
*60s : [27] persons
*70s : [40] persons
*80s : [45] persons
*90s : [30] persons
*over100 : [2] persons
・ [N/A] people is
in 『the entertainment district at night』
→Employees and guests such as host clubs and cabaret clubs
・Infection at home [58] people
・Infection at office [12] people
・Infection at a dinner with friends and acquaintances [6] people
・Infection in the facility [126] people
・Infection via other routes [N/A] people
* Infection in the facility [126] people
[6] medical institutions, [40] people
+ [8] facilities for the elderly, [83] people
*Bed usage rate: 33.9% (←33.9%)
for severely ill people: 20.3% (←20.6%)
*( )= Number of the previous day
(Individual infection information
・It seems that [6] people have died in Tokyo today …
<Number of deaths by route>
・Facilities for the elderly ― [3] person(s)
・Hospital ― [1] person(s)
・Home ― [2] person(s)
・Unknown ― [-] person(s)
(Outbreak information)
・Long-term care health facility “Roken Sumida Akikoen” in Sumida Ward
*Today [41] person(s) / Cumulative [47] person(s)
*** Information on people under medical treatment in Tokyo ***
Number of hospitalized : 1,696 ( +2)
Number of seriously ill : 67 ( -1)
Hotel medical treatment : 386 ( +29)
Home medical treatment : 576 ( -71)
Adjusting for “hospitalization or hotel or home treatment” : 716 ( +72)
People discharged from hospital or
those who have completed medical treatment at home: 106,926 ( +291)
*( )= increase from the day before
Net increase in infected people in Tokyo
= (Number of new infections)
- (Number of people who completed medical treatment)
- (Number of deaths)
= 329 - 291 - 6
= +32 people
Estimated total number of infected people in Tokyo as of today
= (Number of positives)
- (end of medical treatment period such as discharge)
- (Number of deaths)
= 111,676 - 106,926 - 1,376
= 3,374 people
*Tokyo currently has 12 facilities for infected people
(Capacity of 4,947 people)
* A hospital in Tokyo has secured 3280 beds (+220 beds for critically ill patients).
→ Aim to secure 3750 beds (+250 beds for critically ill patients).
* In addition, we will open two specialized hospitals from September to October, and plan to add another 200 beds.
*The hotels are that,
“the b Ikebukuro”, “DayniceHOTEL Tokyo”,
“Toyoko INN Shinjukukabukicho”,
“Toyoko INN Tokyo Station Shinoohashimae”,
“Shinagawa Prince Hotel (East Tower)”,
“Apa Hotel Asakusa Taharamachi Ekimae”,
“Tokyo Toranomon Tokyu REI Hotel”,
“Toyoko Inn Fuchu Nanbu Line Minamitama Station”,
“APA Hotel & Resort Nishi-Shinjuku 5-chome Station Tower”,
“Tokyo Pet-accompanied accommodation facility”,
“APA Hotel Yamanote Otsuka Station Tower”,
“Toyoko Inn Ikebukuro North Exit II”
*The source of the total number of infected persons is from 東京都
■ Of today’s number of infected people [329] …
・Rich contacts [213] people
(about 65% of the total)
・Unknown infection route [116] people
(about 35% of the total)
・Overseas travel history holder [0] person(s)
* Bringing in samples from outside of Tokyo [9 cases]
・Quarantine at the airport
| Case study | Response (arrival date) |
Age | sex | residence | Behavior history | Symptom |
| 2209 | Haneda (2/27) |
10’s | male | Tokyo | Ukraine | Asymptomatic |
| 2210 | Kansai International Airport (2/27) |
50s | male | Fukuoka Prefecture | Pakistan | Asymptomatic |
| 2211 | Kansai International Airport (2/27) |
30s | Female | Osaka | United Arab Emirates | Asymptomatic |
| 2212 | Narita (2/28) |
30s | male | Kanagawa Prefecture | Cote d’Ivoire | Asymptomatic |
| 2213 | Narita (2/28) |
20’s | Female | Kanagawa Prefecture | Cote d’Ivoire | Cough, malaise |
*From the website of the Ministry of Health, Labor and Welfare
*Since the number of new infections in Tokyo seems to be almost the number of the previous day,
(Because the deadline for the number of new infections on the day is from 9:00 am the day before to 9:00 am on the day)
And also today, I will summarize some prefectures that have a high number of infected people, not just in the Tokyo area.
*** Saitama ***
・New infections are [197] people
→Saitama City [17] person(s)
Kawaguchi City [14] person(s)
Koshigaya City [4] person(s)
Kawagoe City [1] person(s)
Other municipalities [61] person(s)
(Individual infection information)
*Today, it seems that one or two people were added to each of the clusters of
[3] medical institutions and
[0] facilities for the elderly.
→Cumulative total of each : [12~64]people
* I’m sorry, but the number of people in Saitama by region comes out, but the details are often late or not come out on the day …
*** Kanagawa ***
・New infections are [131] people
・Rich contacts [90] people
・Unknown infection route [41] people
(Individual infection information)
・Special nursing home for the elderly in Yokohama City
*Today [3] person(s) / Cumulative [46] person(s)
・”Sagamihara Minami Hospital” in Sagamihara City
*Today [25] person(s) / Cumulative [31] person(s)
・Private childcare facility in Atsugi City
*Today [*1] person(s) / Cumulative [30] person(s)
*(*1)6 people from 3 families related today
*Among the infected people counted today, there are [6] cluster relationships, including the above.. (Other than the above, add 1 or less each)
*** Chiba ***
・New infections are [132] people
(Individual infection information)
・Special nursing home for the elderly “Omoiyari no Sato” in Minamiboso City
*Today [12] person(s) / Cumulative [19] person(s)
* Tokyo Disneyland in Urayasu City will close the park one hour ahead of schedule to prevent infection with the new coronavirus. (9 pm → 8 pm)
*** Osaka ***
・New infections are [54] people
・ I couldn’t confirm the information today …
*** Aichi ***
・New infections are [31] people
→Nagoya City [11] people
*** Okinawa ***
・New infections are [15] people
→US military base:[N/A] person(s)
*Cumulative 919 US military personel
*Not included in the number of infected people in Okinawa
*** Fukuoka ***
・New infections are [23] person(s)
→Fukuoka City [5] people
→Kitakyushu City [6] people
(Individual infection information)
・”Yahatanishi Hospital” in Kitakyushu City
*Today [1] person(s) / Cumulative [51] person(s)
◆◆◆ Hokkaido ◆◆◆
・New infections are [27] person(s)
→Sapporo City [9] people
(Individual infection information)
・ “Eniwa Daiichi Hospital” in Eniwa City
*Today [1] person(s) / Cumulative [76] person(s)
・ “Public Memuro Hospital” in Memuro Town
*Today [3]person(s) / Cumulative [22] person(s)
* In Hokkaido, outbreaks are rarely known on the day of the outbreak, and since it will be revealed and announced the next day or later, the cumulative number of people will be announced instead of the number on the day of the outbreak.
◆◆◆ Hyogo ◆◆◆
・New infections are [26] person(s)
・ I couldn’t confirm the information today …
◆◆◆ Kyoto ◆◆◆
・New infections are [3] person(s)
・ I couldn’t confirm the information today …
* Others At this time (20:30), it seems that more than 10 people have been confirmed to be infected in the following areas …
▽ Ibaraki Prefecture has 5755 people (15)
▽ Shizuoka Prefecture has 5141 people (15)
▽ Gunma Prefecture has 4502 people (11)
▽ Miyagi Prefecture has 3623 people (14)
▽ Fukushima Prefecture has 1947 people (16)
*Graph of the number of newly infected people in Japan as of yesterday
(* This bar graph is up to the previous day, so today’s red bar (handwritten) is on the far right, but it’s about this …)
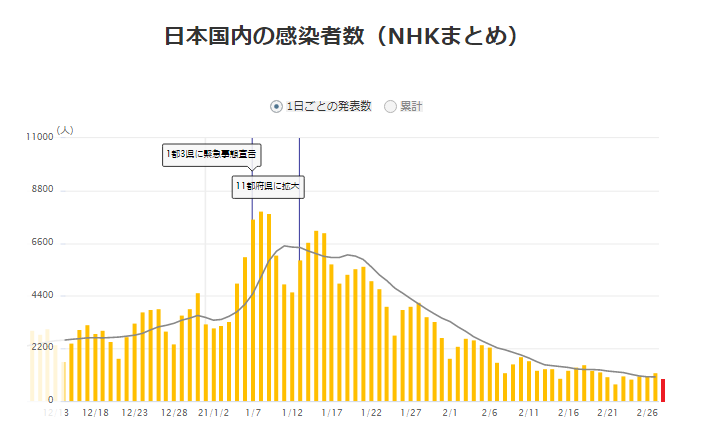
(*”Since the graph shows only the numbers up to the previous day, I handwritten the rightmost bar, but this is about it!”)
(*NHK NEWS WEB)
There wasn’t much news about the “new coronavirus” today …!
Same as when the number of PCR tests for COVID-19 is small,
it is best if
“the number of tests is small = few people get infected and get sick”
=
“there are few articles = the infection situation is improving and there is no need to make news”
Howver, it’s really scary if
“the number of inspections is small = the inspection is not done intentionally”
or
“there are few articles = the news site is relaxed” …!
,right? (dry laugh)
However, I didn’t have much news to summarize, so today I would like to do a “maniac summary”! Lol
What I want to do is “infection status so far” and “change in proportion by age”
It will be a little longer because I will summarize the usual calendar from last year, but please take a look first!
By the way, I was looking at it with memories (?lol) like that!
“Ah, I was thinking about this at this time.”
“Ah, yeah! The number of infected people increased here and I was impatient!”
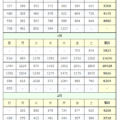
<Infection status of the new coronavirus in Tokyo to date>
(* From the time the virus entered the country to the presentで)
◆Changes in New Coronavirus Infection in Tokyo◆
| Jan(2020) | |||||||
| 日 | 月 | 火 | 水 | 木 | 金 | 土 | Total |
| – | – | – | – | – | – | – | – |
| – | – | – | – | – | – | – | – |
| – | – | – | – | – | – | – | – |
| – | – | – | – | – | 1 | 1 | 2 |
| – | – | – | – | 1 | – | – | 1 |
| Feb(2020) | |||||||
| 日 | 月 | 火 | 水 | 木 | 金 | 土 | Total |
| – | – | – | – | – | – | – | – |
| – | – | – | – | – | – | – | – |
| – | – | – | – | 1 | 2 | 8 | 11 |
| 5 | – | 3 | 3 | – | 3 | 1 | 15 |
| – | 3 | – | 3 | 1 | – | 1 | 8 |
| Mar | |||||||
| 日 | 月 | 火 | 水 | 木 | 金 | 土 | Total |
| 2 | – | 1 | 4 | 8 | 6 | 6 | 27 |
| – | – | 3 | 6 | 2 | 2 | 10 | 23 |
| 3 | – | 12 | 9 | 7 | 11 | 7 | 49 |
| 2 | 16 | 17 | 41 | 47 | 40 | 63 | 226 |
| 68 | 13 | 78 | – | – | – | – | – |
| Apr | |||||||
| 日 | 月 | 火 | 水 | 木 | 金 | 土 | Total |
| – | – | – | 66 | 97 | 89 | 116 | 527 |
| 143 | 83 | 79 | 144 | 178 | 188 | 197 | 1012 |
| 166 | 91 | 161 | 126 | 148 | 201 | 181 | 1074 |
| 107 | 102 | 123 | 132 | 134 | 161 | 103 | 862 |
| 72 | 39 | 112 | 47 | 46 | – | – | – |
| May | |||||||
| 日 | 月 | 火 | 水 | 木 | 金 | 土 | Total |
| – | – | – | – | – | 165 | 160 | 641 |
| 91 | 87 | 58 | 38 | 23 | 39 | 36 | 336 |
| 22 | 15 | 27 | 10 | 30 | 9 | 14 | 127 |
| 5 | 10 | 5 | 5 | 11 | 3 | 2 | 41 |
| 14 | 8 | 10 | 11 | 15 | 22 | 14 | 94 |
| 5 | – | – | – | – | – | – | – |
| Jun | |||||||
| 日 | 月 | 火 | 水 | 木 | 金 | 土 | Total |
| – | 13 | 34 | 12 | 28 | 20 | 26 | 138 |
| 14 | 12 | 13 | 18 | 22 | 25 | 24 | 104 |
| 47 | 48 | 27 | 16 | 41 | 35 | 39 | 253 |
| 35 | 29 | 31 | 55 | 48 | 54 | 57 | 309 |
| 60 | 58 | 54 | – | – | – | – | – |
| Jul | |||||||
| 日 | 月 | 火 | 水 | 木 | 金 | 土 | Total |
| – | – | – | 67 | 107 | 124 | 131 | 601 |
| 111 | 102 | 106 | 75 | 224 | 243 | 206 | 1067 |
| 206 | 119 | 143 | 165 | 286 | 293 | 290 | 1502 |
| 188 | 168 | 237 | 238 | 366 | 260 | – | – |
| Aug | |||||||
| 日 | 月 | 火 | 水 | 木 | 金 | 土 | Total |
| – | – | – | – | – | – | 472 | 2187 |
| 292 | 258 | 309 | 263 | 360 | 462 | 429 | 2373 |
| 331 | 197 | 188 | 222 | 206 | 389 | 385 | 1918 |
| 260 | 161 | 207 | 186 | 339 | 258 | 256 | 1667 |
| 212 | 95 | 182 | 236 | 250 | 226 | 247 | 1448 |
| 148 | 100 | – | – | – | – | – | – |
| Sep | |||||||
| 日 | 月 | 火 | 水 | 木 | 金 | 土 | Total |
| – | – | 170 | 141 | 211 | 136 | 181 | 1087 |
| 116 | 77 | 170 | 149 | 276 | 187 | 226 | 1201 |
| 146 | 80 | 191 | 163 | 171 | 220 | 218 | 1189 |
| 162 | 98 | 88 | 59 | 195 | 195 | 270 | 1067 |
| 144 | 78 | 212 | 194 | – | – | – | – |
| Oct | |||||||
| 日 | 月 | 火 | 水 | 木 | 金 | 土 | Total |
| – | – | – | – | 235 | 196 | 207 | 1266 |
| 108 | 66 | 177 | 142 | 248 | 203 | 249 | 1193 |
| 146 | 78 | 166 | 177 | 284 | 184 | 235 | 1270 |
| 132 | 78 | 139 | 150 | 185 | 186 | 203 | 1073 |
| 124 | 102 | 158 | 171 | 221 | 204 | 215 | 1195 |
| Nov | |||||||
| 日 | 月 | 火 | 水 | 木 | 金 | 土 | Total |
| 116 | 98 | 209 | 122 | 269 | 242 | 294 | 1339 |
| 189 | 157 | 293 | 317 | 393 | 374 | 352 | 2075 |
| 255 | 180 | 298 | 493 | 534 | 522 | 539 | 2821 |
| 391 | 314 | 186 | 401 | 481 | 570 | 561 | 2904 |
| 418 | 311 | – | – | – | – | – | – |
| Dec | |||||||
| 日 | 月 | 火 | 水 | 木 | 金 | 土 | Total |
| – | – | 372 | 500 | 533 | 449 | 584 | 3167 |
| 327 | 299 | 352 | 572 | 602 | 595 | 621 | 3368 |
| 480 | 305 | 460 | 678 | 821 | 664 | 736 | 4145 |
| 556 | 392 | 563 | 748 | 888 | 884 | 949 | 4980 |
| 708 | 481 | 856 | 944 | 1337 | – | – | – |
| Jan | |||||||
| 日 | 月 | 火 | 水 | 木 | 金 | 土 | Total |
| – | – | – | – | – | 783 | 814 | 5923 |
| 816 | 884 | 1278 | 1591 | 2447 | 2392 | 2268 | 11676 |
| 1494 | 1219 | 970 | 1433 | 1502 | 2001 | 1809 | 10428 |
| 1592 | 1204 | 1240 | 1274 | 1471 | 1175 | 1070 | 9026 |
| 986 | 618 | 1026 | 973 | 1064 | 868 | 769 | 6304 |
| 633 | – | – | – | – | – | – | – |
| Feb | |||||||
| 日 | 月 | 火 | 水 | 木 | 金 | 土 | Total |
| – | 393 | 556 | 676 | 734 | 577 | 639 | 4208 |
| 429 | 276 | 412 | 491 | 434 | 307 | 369 | 2718 |
| 371 | 266 | 350 | 378 | 445 | 353 | 327 | 2490 |
| 272 | 178 | 275 | 213 | 340 | 270 | 337 | 1885 |
| – | – | – | – | – | – | – | – |
*Unit: person (number of infected people on that day)
* There are some parts where the numbers have changed due to a counting error in Tokyo.
①Where the background is painted red
April 16: State of emergency is announced
May 25: State of emergency lifted
January 8: State of Emergency Declaration Recurrence Order
Currently: The state of emergency is being announced.
②The areas painted in yellow
are the weeks when the number of infected people has decreased the most since April in Tokyo.
③The areas painted in green are gradually relaxed in Tokyo after Emergency declaration
June 19:全面解除:東 The regulation of Tokyo is completely lifted.
です。
④And the place where the first letter in August is red is “the peak of the second wave in Tokyo”.
⑤Also, the gray areas are consecutive holidays
* During the holidays, the number of tests is small and the number of people in the city increases, which tends to affect the spread of infection. Before and after the holidays, the number of infected people announced fluctuates, so the colors are changed to make it easier to understand.
⑥ The blue part is the start date of participation in the “Go To (Travel) Campaign” in Tokyo.
⑦Red letters and red background after January
Red letters: days over 1000 people
Red background: During the state of emergency recurrence order
Information from↓
※この記事から現在までの情報を加えています。
If you look at it like this, you can see how abnormal it is to exceed 1000 people every day from the year-end and New Year holidays to January.
Just looking at it makes me scared …
And the change in the ratio by age, but this is the original data! ↓
<Ratio of infected persons by age on each important day in Tokyo>
| Date | Under 10 | 10s | 20s | 30s | 40s | 50s | 60s | 70s | 80s | 90s | Over 100 | Unknown | *1 |
| 4/17 | 2 | 2 | 30 | 32 | 36 | 33 | 26 | 17 | 18 | 4 | 0 | 1 | 201 |
| 5/29 | 0 | 0 | 4 | 7 | 2 | 3 | 1 | 4 | 0 | 0 | 0 | 0 | 21 |
| 8/1 | 9 | 15 | 216 | 108 | 51 | 38 | 21 | 7 | 6 | 1 | 0 | 0 | 472 |
| 9/3 | 4 | 12 | 62 | 45 | 30 | 30 | 7 | 9 | 7 | 5 | 0 | 0 | 211 |
| 10/24 | 1 | 13 | 61 | 40 | 25 | 24 | 17 | 14 | 6 | 0 | 0 | 0 | 201 |
| 11/18 | 6 | 20 | 123 | 92 | 85 | 63 | 38 | 30 | 25 | 3 | 0 | 0 | 485 |
| 12/31 | 29 | 82 | 385 | 248 | 195 | 178 | 88 | 62 | 51 | 18 | 1 | 0 | 1337 |
| 1/7 | 53 | 128 | 666 | 552 | 408 | 303 | 143 | 98 | 76 | 18 | 2 | 0 | 2447 |
(*1 =Total number of infected people in Tokyo)
But only this, you may think “What are you talking about?” , right?
So, make this a percentage (%) …
<Percentage of infected people by age on each important day in Tokyo (%)>
| Date | Under 10 | 10s | 20s | 30s | 40s | 50s | 60s | 70s | 80s | 90s | Over 100 | Unknown | *1 |
| 4/17 | 1% | 1% | 15% | 16% | 18% | 16% | 13% | 8% | 9% | 2% | 0% | 0% | 201 |
| 5/29 | 0% | 0% | 19% | 33% | 10% | 14% | 5% | 19% | 0% | 0% | 0% | 0% | 21 |
| 8/1 | 2% | 3% | 46% | 23% | 11% | 8% | 4% | 1% | 1% | 0% | 0% | 0% | 472 |
| 9/3 | 2% | 6% | 29% | 21% | 14% | 14% | 3% | 4% | 3% | 2% | 0% | 0% | 211 |
| 10/24 | 0% | 6% | 30% | 20% | 12% | 12% | 8% | 7% | 3% | 0% | 0% | 0% | 201 |
| 11/18 | 1% | 4% | 25% | 19% | 18% | 13% | 8% | 6% | 5% | 1% | 0% | 0% | 485 |
| 12/31 | 2% | 6% | 29% | 19% | 15% | 13% | 7% | 5% | 4% | 1% | 0% | 0% | 1337 |
| 1/7 | 2% | 5% | 27% | 23% | 17% | 12% | 6% | 4% | 3% | 1% | 0% | 0% | 2447 |
(*1 =Total number of infected people in Tokyo)
Even this is difficult to understand …!
So 1 more …!
<Percentage of infected people by generation on each important day in Tokyo (%)>
| Date | Under 20 | 20s-30s | 40s-50s | Over 60s | *1 |
| 4/17 | 2% | 31% | 34% | 32% | 201 |
| 5/29 | 0% | 52% | 24% | 24% | 21 |
| 8/1 | 5% | 69% | 19% | 7% | 472 |
| 9/3 | 8% | 51% | 28% | 13% | 211 |
| 10/24 | 7% | 50% | 24% | 18% | 201 |
| 11/18 | 5% | 44% | 31% | 20% | 485 |
| 12/31 | 8% | 47% | 28% | 16% | 1337 |
| 1/7 | 7% | 50% | 29% | 14% | 2447 |
(*1 =Total number of infected people in Tokyo)
Looking at it this way, the infection rate of other generations does not change much, but the rate of people in their 20s and 30s fluctuates considerably, as you can see from the data …!
However, I’m still worried that since the school reopened in June (probably), the infection of children under the age of 20 has increased from 0% to nearly 10%.
And here is the current infection status … ↓
<Recent percentage of infected people in Tokyo>
| Date | Under 20 | 20-30 | 40s-50s | Over 60s | *1 |
| 2/27 | 9% | 42% | 29% | 20% | 337 |
| 2/26 | 8% | 41% | 24% | 26% | 270 |
| 2/25 | 8% | 33% | 33% | 26% | 340 |
| 2/24 | 9% | 25% | 33% | 33% | 213 |
| 2/23 | 8% | 40% | 23% | 29% | 275 |
| 2/22 | 7% | 39% | 29% | 25% | 178 |
| 2/21 | 6% | 39% | 31% | 24% | 272 |
| 2/20 | 9% | 36% | 27% | 27% | 327 |
(*1 =Total number of infected people in Tokyo)
At present, the atmosphere has changed dramatically from the data so far, and while “the ratio of people in their 20s and 30s has dropped to an unprecedented level”, “the percentage of people over the age of 60 has risen like never before” …!
Not only the percentage, but also the actual numbers,
| Date | Under 20 | 20s-30s | 40s-50s | Over 60 | *1 |
| 8/1 | 24 | 324 | 89 | 35 | 472 |
| 9/1 | 16 | 107 | 60 | 28 | 211 |
| 10/24 | 14 | 101 | 49 | 37 | 201 |
| 11/18 | 26 | 215 | 148 | 96 | 485 |
(*1 =Total number of infected people in Tokyo)
(* Around the same infection situation as these days)
| Date | Under 20 | 2os-30s | 40s-50s | Over 60 | *1 |
| 2/27 | 30 | 140 | 98 | 69 | 337 |
| 2/26 | 22 | 111 | 66 | 71 | 270 |
| 2/25 | 28 | 112 | 113 | 87 | 340 |
| 2/24 | 19 | 53 | 70 | 71 | 213 |
| 2/23 | 23 | 111 | 62 | 79 | 275 |
| 2/22 | 12 | 69 | 52 | 45 | 178 |
| 2/21 | 17 | 107 | 84 | 64 | 272 |
| 2/20 | 31 | 119 | 88 | 89 | 327 |
(*1 =Total number of infected people in Tokyo)
After all, what stands out is that the number of infected people over the age of 60 has nearly doubled …!
On the contrary, in terms of proportion, the number of infected people seems to decrease in their 20s and 30s,
but when looking at the actual number of infected people
(although there are days when it has decreased abnormally)
since there are about 110 people, which is not much different from September / October,
the proportion of people in their 20s and 30s has decreased because “the infection of the elderly is increasing” rather than “the behavior of young people has changed”.
It looks like so from the data …!
The number of people under the age of 20 and those in their 40s and 50s is almost the same as in autumn!
<Summary>
Around April:
About 20 years old and over are almost the same% for all generations
Second wave peak (August):
About 70% of all infected people was in their 20s and 30s every day
Third wave peak (January):
The number of infected people has increased dramatically in all generations (the ratio by age has not changed)
the current:
There are many infections in the elderly,
The number of infected people in other generations is almost the same as in autumn
…?
“Almost the same as in autumn” …? what? Did the decrease stop after all? !!
And this article↓
How long time the materials such as paper, cloth, plastic, etc. need to eliminating the risk when coronavirus is attached, and how effective disinfection is.
If you are interested, please take a look!
And here’s a trial calculation of how many people in Japan are actually receiving medical treatment.
(Number of people infected nationwide) 433,432
+ (Number of hospital discharges ) 7,910
+ (Number of hospital discharges ) 409,978
= 15,544 people ( -331) ← being treated
*()=increase from the day before
(If it is exactly as announced)
For those who are undergoing medical treatment nationwide are…
It is steadily decreasing as the number of infected people in Japan decreases!
This space is always the closing section of the “summary article” …but…
I’m tired… of looking up ……the data………… today …………
(lol)
Please be very careful when you go out!
AcertainFox512
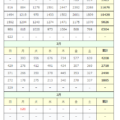
◆Changes in New Coronavirus Infection in Tokyo◆
| Dec | |||||||
| Sun | Mon | Tue | Wed | Thu | Fri | Sat | Total |
| – | – | 372 | 500 | 533 | 449 | 584 | 3167 |
| 327 | 299 | 352 | 572 | 602 | 595 | 621 | 3368 |
| 480 | 305 | 460 | 678 | 821 | 664 | 736 | 4145 |
| 556 | 392 | 563 | 748 | 888 | 884 | 949 | 4980 |
| 708 | 481 | 856 | 944 | 1337 | – | – | – |
| Jan | |||||||
| Sun | Mon | Tue | Wed | Thu | Fri | Sat | Total |
| – | – | – | – | – | 783 | 814 | 5923 |
| 816 | 884 | 1278 | 1591 | 2447 | 2392 | 2268 | 11676 |
| 1494 | 1219 | 970 | 1433 | 1502 | 2001 | 1809 | 10428 |
| 1592 | 1204 | 1240 | 1274 | 1471 | 1175 | 1070 | 9026 |
| 986 | 618 | 1026 | 973 | 1064 | 868 | 769 | 6304 |
| 633 | – | – | – | – | – | – | – |
| Feb | |||||||
| Sun | Mon | Tue | Wed | Thu | Fri | Sat | Total |
| – | 393 | 556 | 676 | 734 | 577 | 639 | 4208 |
| 429 | 276 | 412 | 491 | 434 | 307 | 369 | 2718 |
| 371 | 266 | 350 | 378 | 445 | 353 | 327 | 2490 |
| 272 | 178 | 275 | 213 | 340 | 270 | 337 | 1885 |
| 329 | – | – | – | – | – | – | – |
*Unit: person (number of infected people on that day)
コメント