*** This article is written with the help of Google Translate… ***
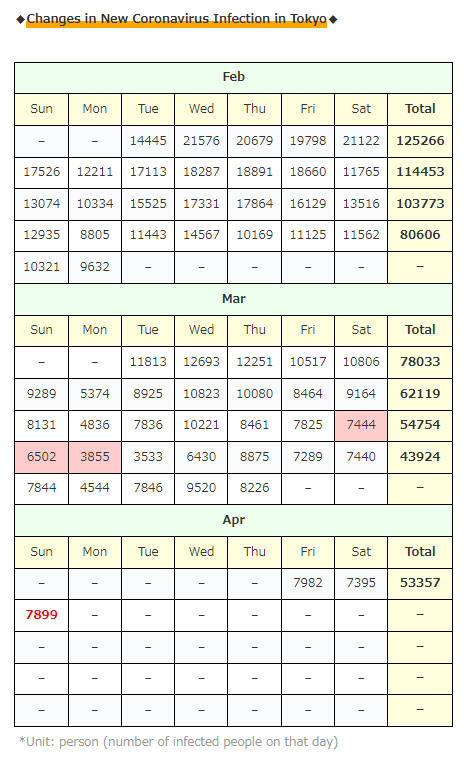
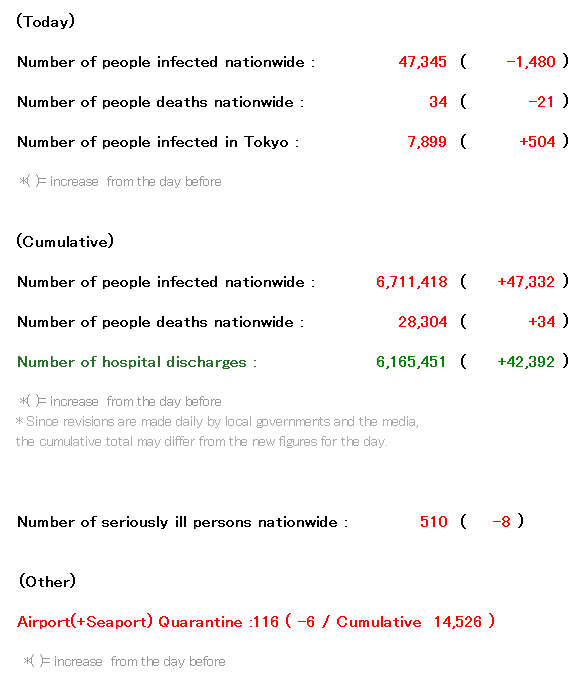
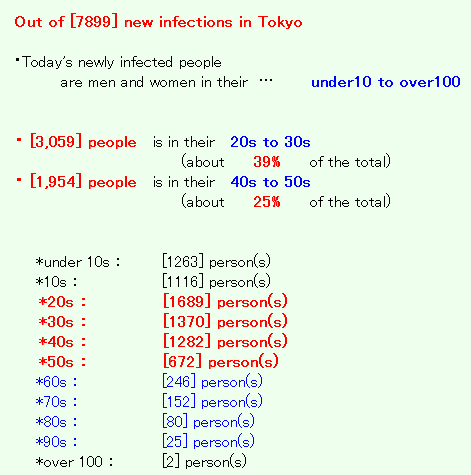
7,899 (+504 from the day before) new infections confirmed in Tokyo.
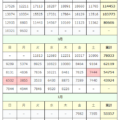
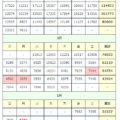
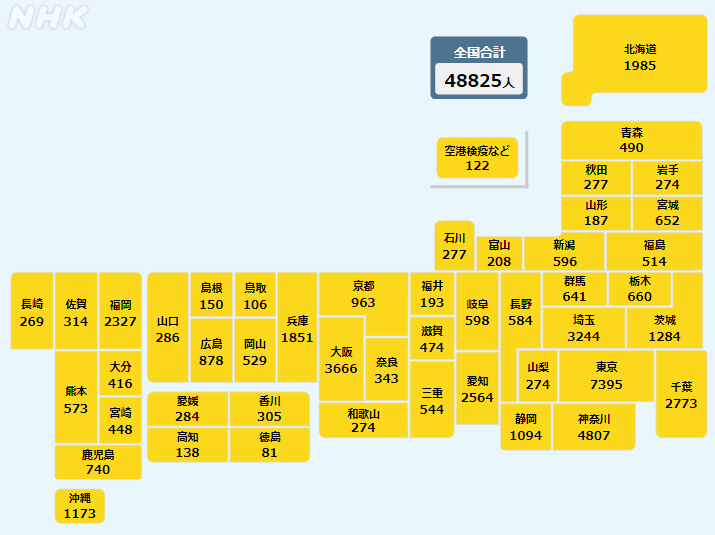
◆◆◆ Japan ◆◆◆
(Cumulative) * The following is up to 10 worst prefectures.
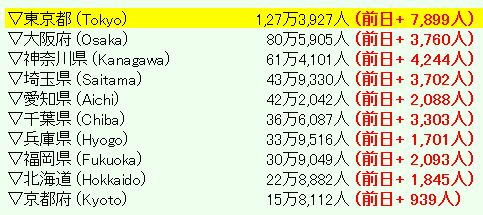
*( )= increase from the day before
(*All of the above from NHK NEWS WEB)
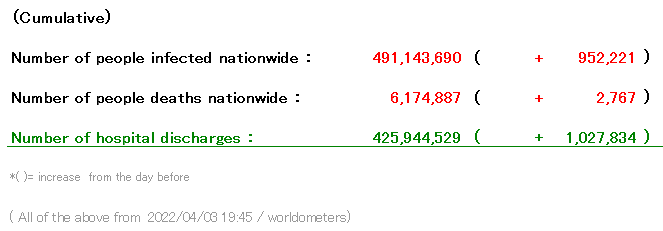
◆◆◆ World ◆◆◆
The number of infected people in Tokyo is ….
Today is about the same as last week …
Should I think “I’m glad it didn’t increase!” Or “It’s not decreasing …” …
Meanwhile… How about the amount of people in the city in Tokyo…↓
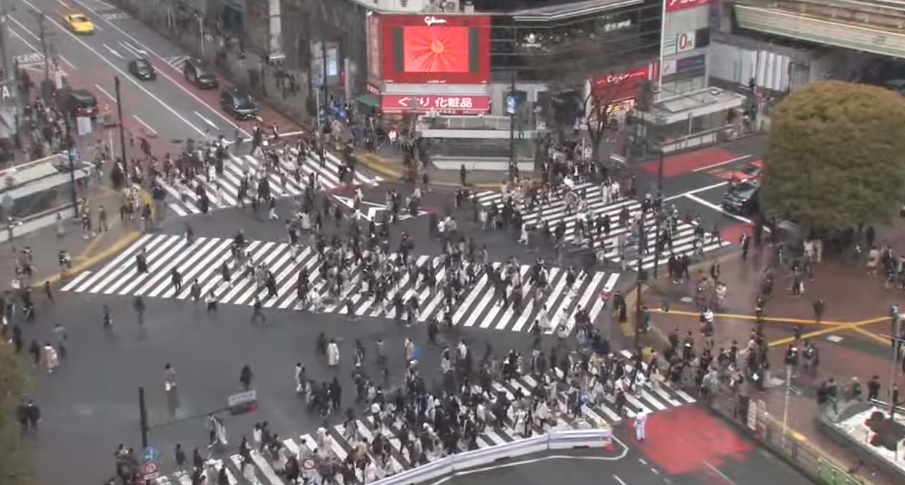
(Around 15:00 today, Shibuya Scramble Crossing, Tokyo)
Well, I will summarize
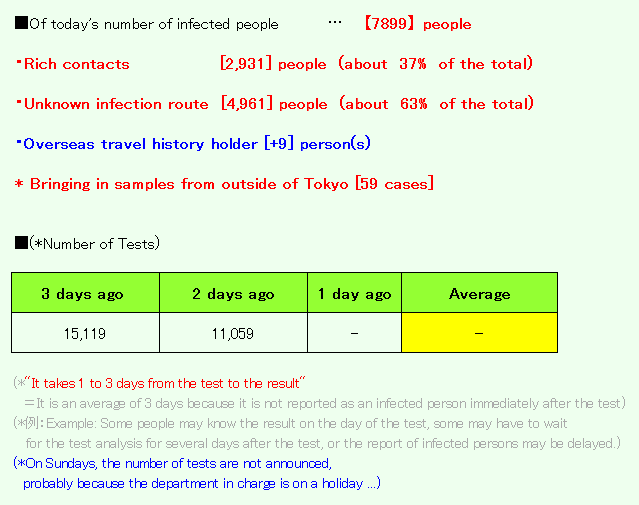
the breakdown of the number of new infections in Tokyo + α …!
・ [N/A] people is
in 『the entertainment district at night』
→Employees and guests such as host clubs and cabaret clubs
・Infection at home [1997] people
・Infection at office [-] people
・Infection in the facility [-] people
・Infection by eating out [-] people
・Infection via other routes [-] people
(Individual infection information)
・Of the【7,899】 people today, 【3851】 people (49%) seem to have completed both vaccinations …
・ The positive rate in the test in Tokyo seems to be 【34.4%】 as of Mar 04
(Red letters are as of January 27, 2022)
*Tokyo currently has 16 facilities for infected people→19 facilities
(Capacity of 6,240 people)→7976 rooms (5420 people)
(*Since space for staff and storage space for materials are also required, the number that can be accommodated is smaller than the number secured)
* A hospital in Tokyo has secured 5967 beds (+392 beds→510 beds for critically ill patients).→6919 beds
→ According to national standards, the number of beds for severe cases was 1207. (*Yahoo!)→1468 beds
*The hotels are that,
the b Ikebukuro
Toyoko Inn Shinjuku Kabukicho
Toyoko Inn Tokyo Station Shin-Ohashi-mae
East Tower (Shinagawa Prince Hotel)
Toyoko Inn Fuchu Nanbu Line Minamitama Station
APA Hotel & Resort Nishi-Shinjuku 5-chome Station Tower
Toyoko Inn Ikebukuro North Exit II
In front of APA Hotel Pride Parliament Building
APA Hotel Higashi Shinjuku Kabukicho Tower
Tokyu Stay Takanawa
APA Hotel Shinjuku Gyoenmae
Comfort Hotel Tokyo Higashi Nihonbashi
APA Hotel TKP Nippori Ekimae
Far East Village Hotel Tokyo Ariake
Hotel Gracery Shinjuku
Tokyo Bay Ariake Washington Hotel
Toyoko Inn Haneda Airport 2
Candeo Hotels Ueno Park
Tokyo Pet-accompanied accommodation medical treatment facility
(Discontinued facility)
Day Nice Hotel Tokyo * Ended May 31, 3rd year of Reiwa
APA Hotel Asakusa Taharamachi Ekimae * Ended March 31, 3rd year of Reiwa
Tokyo Toranomon Tokyu REI * Ended March 31, 3rd year of Reiwa
Toyoko Inn Fuchu Nanbu Line Minamitama Station * Ended April 16, 3rd year of Reiwa
APA Hotel Yamanote Otsuka Station Tower * Temporarily suspended
APA Hotel Shinagawa Izumidakeji Ekimae * Temporarily suspended
Hachioji Sky Hotel * Ended October 31, 3rd year of Reiwa
Kichijoji Tokyu REI * Ended January 15, 4th year of Reiwa
※ 東京都福祉保健局 ※1施設追加|東京都 ※宿泊療養について(施設名一覧あり)
※ 東京で宿泊療養3千人止まり 即時対応難しく – Yahoo!
※感染者総数試算のソースは東京都の『新型コロナウイルス感染症対策サイト』より
・Quarantine at the airport passengers arriving at the airport from overseas.
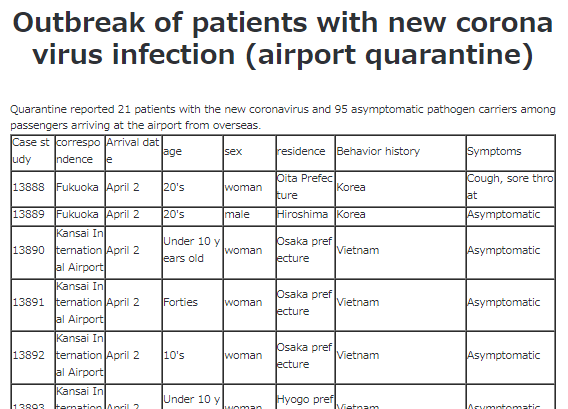
↓ ↓ ↓
(↑Please click the image to continue)
From the website of the Ministry of Health, Labor and Welfare
Click here for detailed information on current border measures and isolation period ↓
(*海外安全ホームページ – 外務省)
*Since the number of new infections in Tokyo seems to be almost the number of the previous day,
(Because the deadline for the number of new infections on the day is from 9:00 am the day before to 9:00 am on the day)
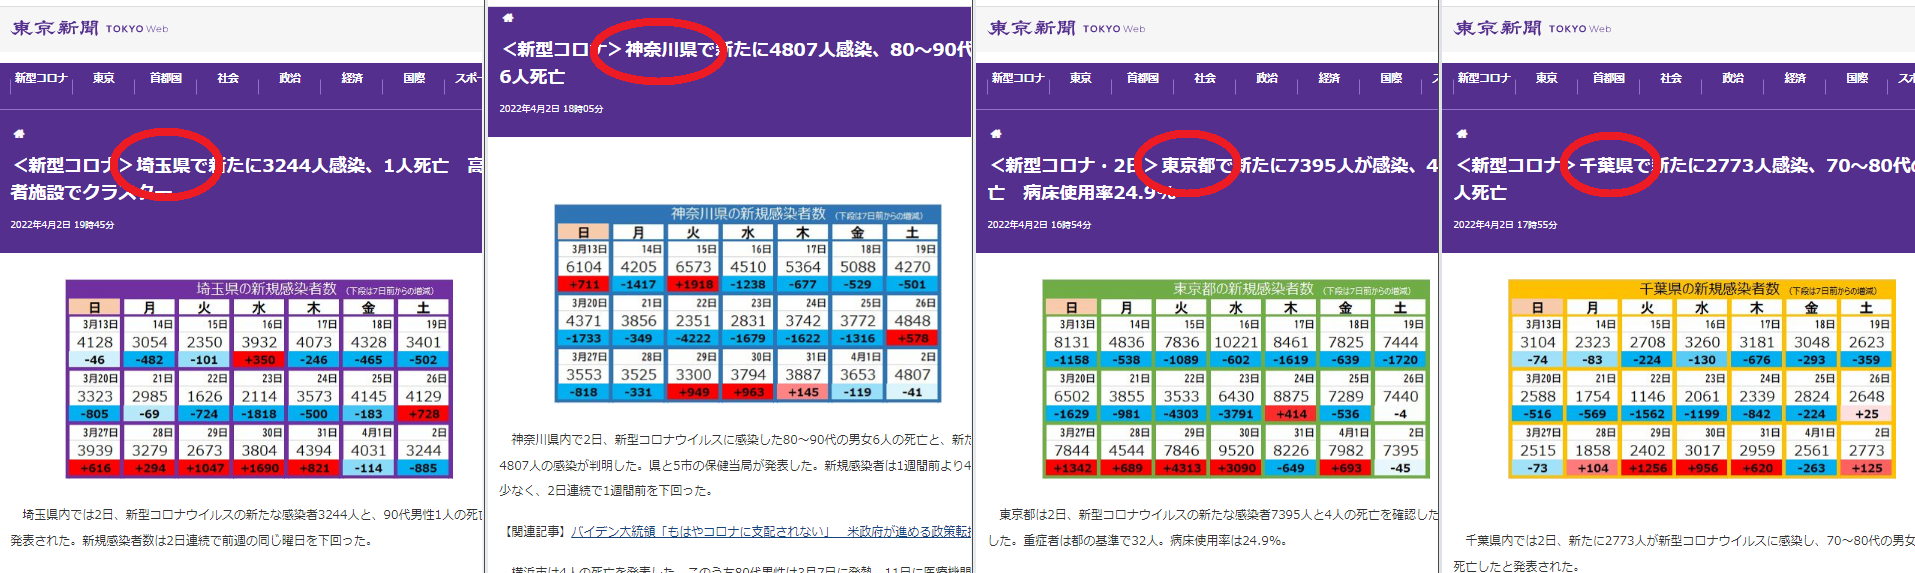
And also today, I will summarize some prefectures that have a high number of infected people, not just in the Tokyo area.
*** Saitama ***
・New infections are [3702] people (*Max of up to yesterday=7354)
(Individual infection information)
・It seems that clusters have been confirmed in a total of [?] locations …
*** Kanagawa ***
・New infections are [4244] people (*Max of up to yesterday=9097)
(Individual infection information)
・It seems that clusters have been confirmed in a total of [?] locations …
*** Chiba ***
・New infections are [3303] people (*Max of up to yesterday=6604)
(Individual infection information)
・It seems that new clusters have been confirmed in a total of [3] locations …
*The following areas introduced until the other day will be excluded for a while.
①About “Osaka / Aichi / Okinawa / Hyogo / Kyoto”
→I have summarized this for the past year, but the details of the infection rarely appear during the day.
②About “Hokkaido”
→Infection is settling down
* In addition, the number of infected people in each prefecture at the present time (19:00) seems to be like this! ↓
*Graph of the number of newly infected people in Japan as of yesterday
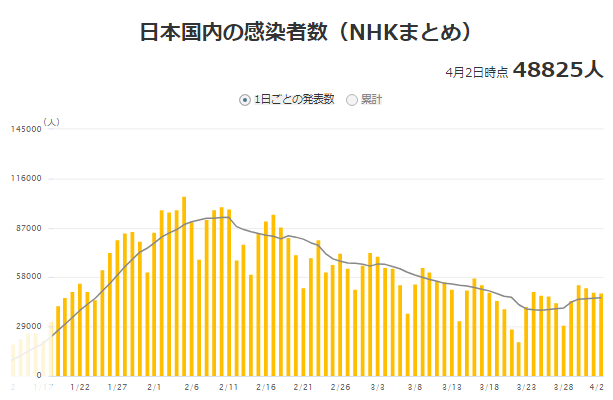
(*NHK NEWS WEB)
<Summary of today’s “Major News Related to COVID-19 in Japan”>
By the way, it seems that “Omicron variant XE” has also occurred in the world …
Of course it’s not a lie, right?
↓
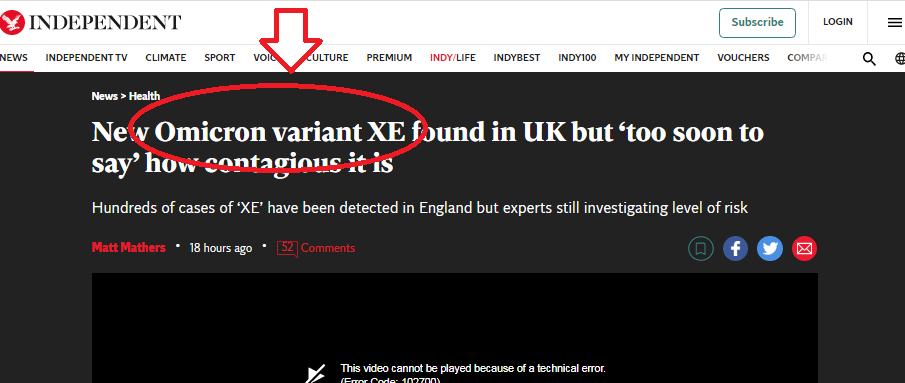
Although it is many times more toxic than influenza,
it has been left unattended to spread as much as influenza,
so new variants will be generated more and more like influenza …!
By the way, how long it has been left unattended … For example, the current test positive rate in Tokyo is like this … ↓
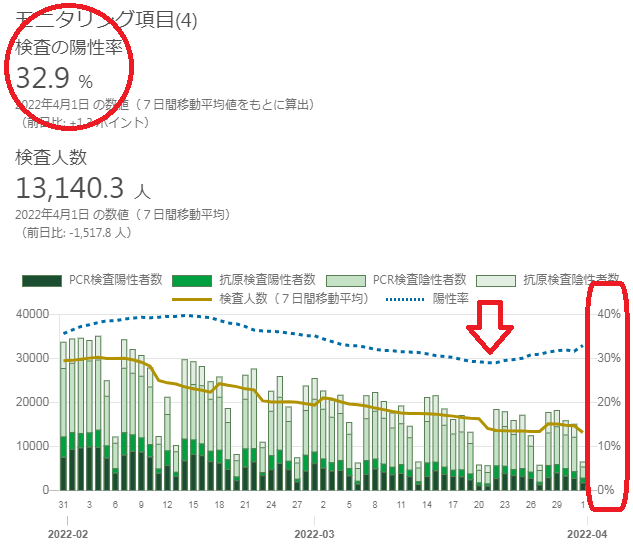
↑The test positive rate remains at 30% or more, which is another dimension, because the restrictions are only relaxed without taking any measures …
(*Until now, the time when the infection had subsided was less than 2% in Japan)
And the current infection rate by age in Tokyo is like this ↓
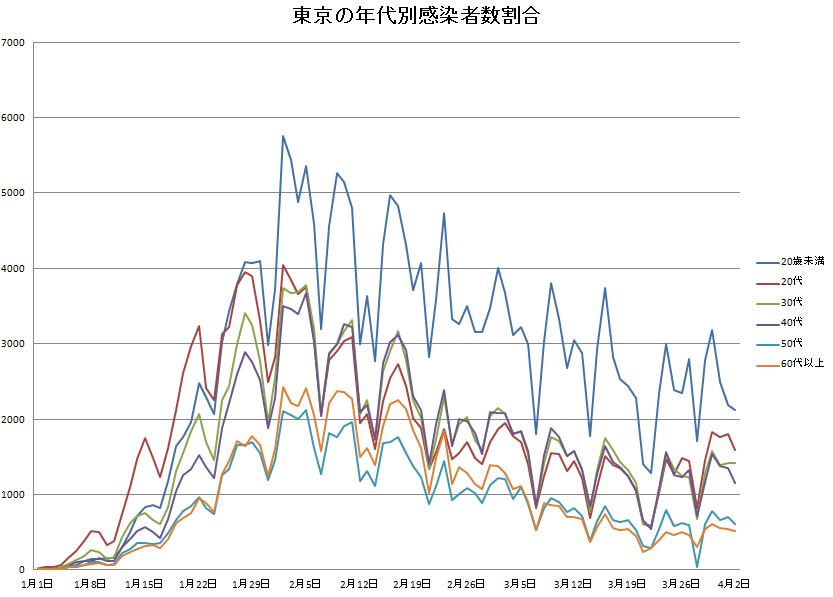
↑Until now, there were an unusually large number of people in their twenties, but this time the sixth wave has similar movements and numbers except for those under the age of 20.
Maybe it’s because the main character, Omicron variant, is so infectious that it gets infected regardless of daily activities,
or
because most of the people other than those in their twenties are no longer refraining from activities,
but I’m not sure if it’s averaging or why the infection rate is averaging …
By the way, you may think that
“Under 20 years old is for two generations under 10 years old and teenagers? The population is different!”
, but … ↓
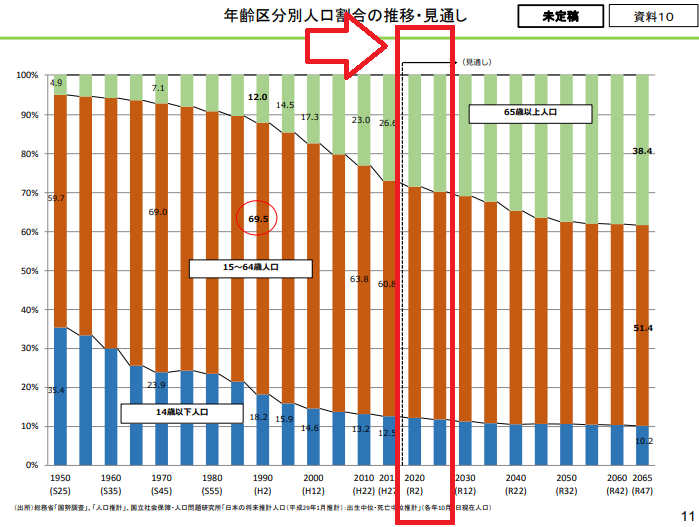
↑According to data from the government tax commission
0-14 years old → Approximately 10%
15-64 years old → Approximately 60%
65 years old and over → Approximately 30%
So … I wonder if the population ratio is about 15% in the case of “under 20 years old”?
After all, “high / low population ratio” does not seem to have much to do with the infection rate …
Hmmm… I wonder if it’s related to bevaccinated or not…?
It seems that the infection prevention effect of vaccination is about 50%, so it is [amulet level] in the sense of preventing infection, but after all, if you look at the data like this, it seems to be better to do it than not …
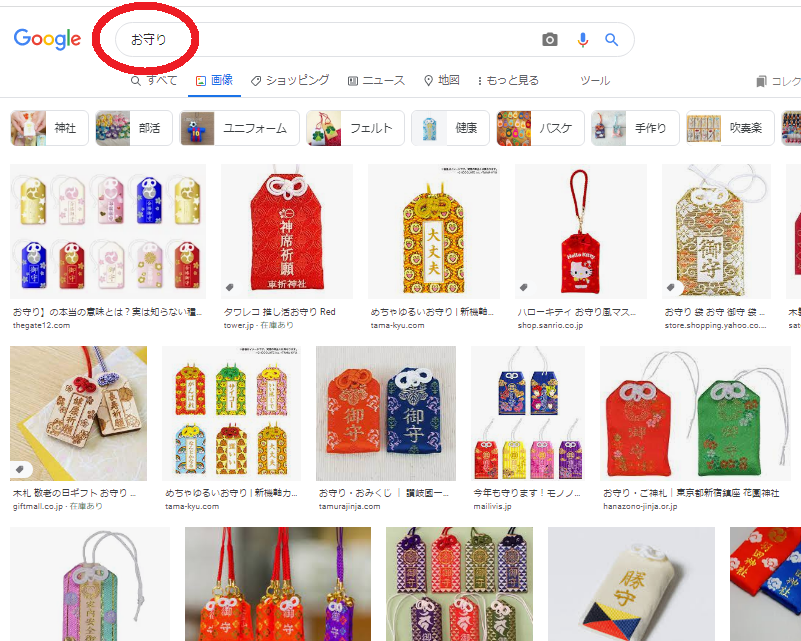
(↑amulet in Japan lol)
It seems that neither the government nor the people are willing to refrain from activities anymore, but is it really okay to continue as it is?
Are you going to live with a mask for the rest of your life? !! ?? !! ?? !! ?? !!
I want to remove the mask, so I want to suppress the infection …! Crying
↓ In addition, there was such an article! ↓
And this article↓
How long time the materials such as paper, cloth, plastic, etc. need to eliminating the risk when coronavirus is attached, and how effective disinfection is.
If you are interested, please take a look!
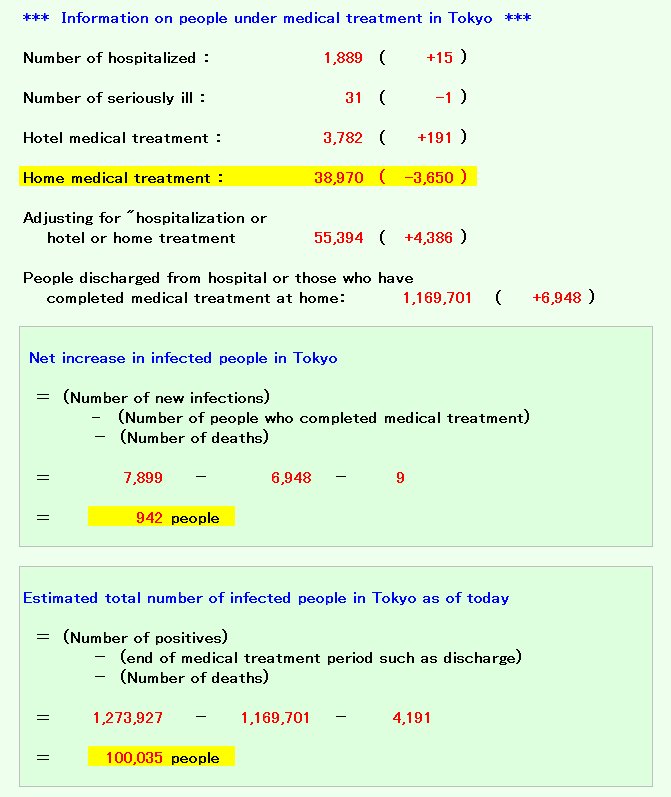
And here’s a trial calculation of how many people in Japan are actually receiving medical treatment.
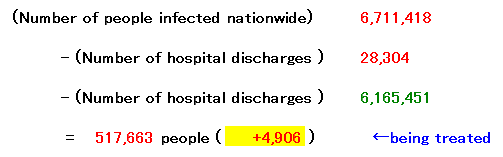
(If it is exactly as announced)
For those who are undergoing medical treatment nationwide are…
It’s increasing every day, but there are days when it’s decreasing …!
By the way, the infection spreads every year at this time of year due to “Spring break & work transfer season & graduation / admission season”, but the current transition of 1 metropolitan area and 3 prefectures is like this … ↓
↑ Oh … It seems that the number of 3 prefectures hasn’t decreased so much …?
If I try to make a graph … ↓
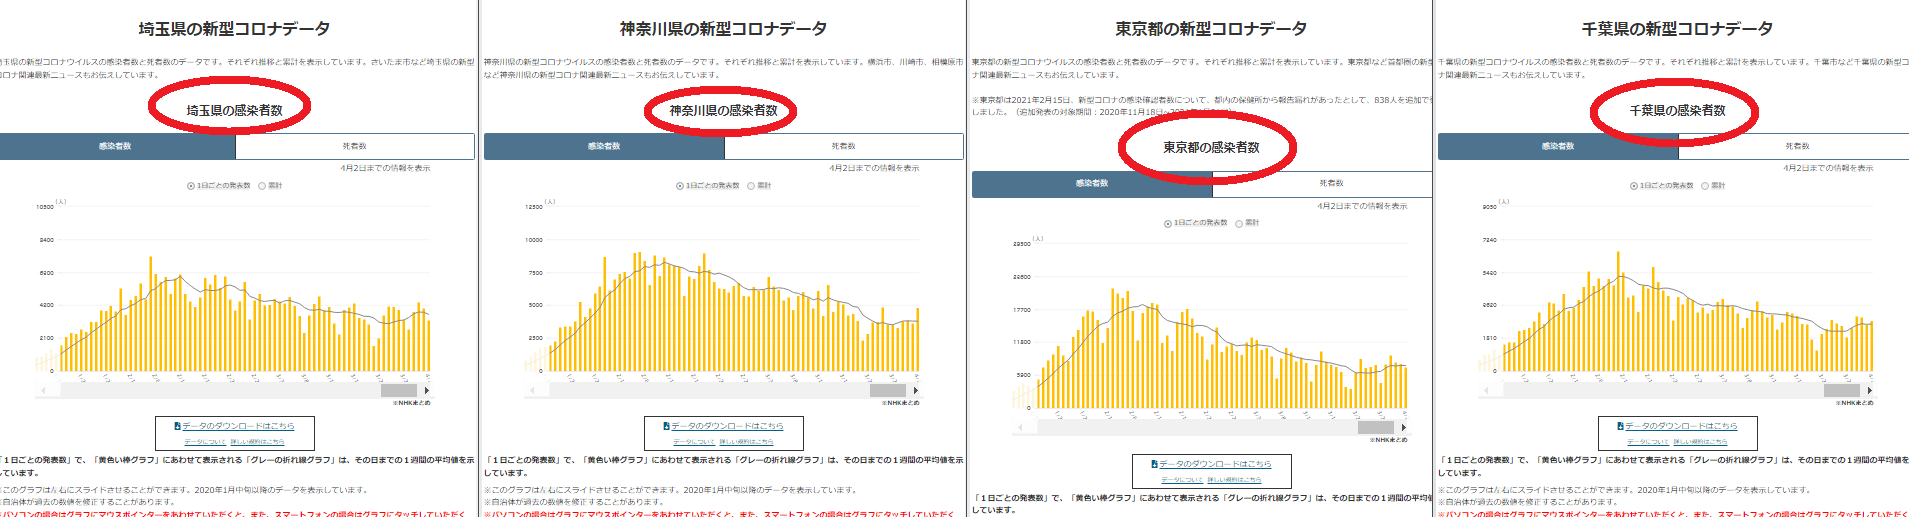
↑ It seems that Tokyo has decreased a little from the unusually large number, but it has not decreased at all in 1 metropolitan area and 3 prefectures …?
Next time, I will compare the number of seriously ill and the number of deaths when I have time …
Please be careful when you go out!
AcertainFox512
◆Changes in New Coronavirus Infection in Tokyo◆
| Feb | |||||||
| Sun | Mon | Tue | Wed | Thu | Fri | Sat | Total |
| – | – | 14445 | 21576 | 20679 | 19798 | 21122 | 125266 |
| 17526 | 12211 | 17113 | 18287 | 18891 | 18660 | 11765 | 114453 |
| 13074 | 10334 | 15525 | 17331 | 17864 | 16129 | 13516 | 103773 |
| 12935 | 8805 | 11443 | 14567 | 10169 | 11125 | 11562 | 80606 |
| 10321 | 9632 | – | – | – | – | – | – |
| Mar | |||||||
| Sun | Mon | Tue | Wed | Thu | Fri | Sat | Total |
| – | – | 11813 | 12693 | 12251 | 10517 | 10806 | 78033 |
| 9289 | 5374 | 8925 | 10823 | 10080 | 8464 | 9164 | 62119 |
| 8131 | 4836 | 7836 | 10221 | 8461 | 7825 | 7444 | 54754 |
| 6502 | 3855 | 3533 | 6430 | 8875 | 7289 | 7440 | 43924 |
| 7844 | 4544 | 7846 | 9520 | 8226 | – | – | – |
| Apr | |||||||
| Sun | Mon | Tue | Wed | Thu | Fri | Sat | Total |
| – | – | – | – | – | 7982 | 7395 | 53357 |
| 7899 | 4384 | – | – | – | – | – | – |
| – | – | – | – | – | – | – | – |
| – | – | – | – | – | – | – | – |
| – | – | – | – | – | – | – | – |
*Unit: person (number of infected people on that day)